Review
. 2016 Jun 1;24(16):939-58.
doi: 10.1089/ars.2015.6415.

Imaging Reactive Oxygen Species-Induced Modifications in Living Systems

Affiliations
Review

Imaging Reactive Oxygen Species-Induced Modifications in Living Systems

Giuseppe Maulucci et al. Antioxid Redox Signal. .

Abstract

Significance: Reactive Oxygen Species (ROS) may regulate signaling, ion channels, transcription factors, and biosynthetic processes. ROS-related diseases can be due to either a shortage or an excess of ROS.

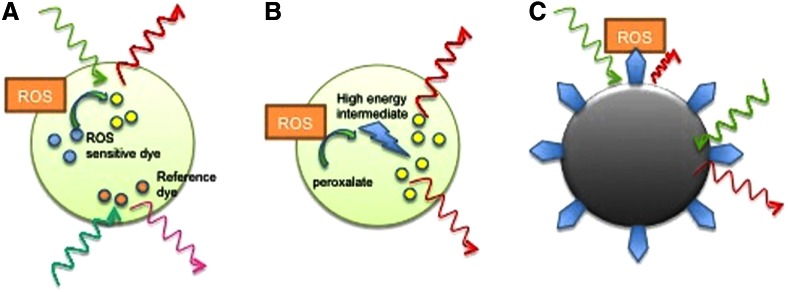
Recent advances: Since the biological activity of ROS depends on not only concentration but also spatiotemporal distribution, real-time imaging of ROS, possibly in vivo, has become a need for scientists, with potential for clinical translation. New imaging techniques as well as new contrast agents in clinically established modalities were developed in the previous decade.

Critical issues: An ideal imaging technique should determine ROS changes with high spatio-temporal resolution, detect physiologically relevant variations in ROS concentration, and provide specificity toward different redox couples. Furthermore, for in vivo applications, bioavailability of sensors, tissue penetration, and a high signal-to-noise ratio are additional requirements to be satisfied.

Future directions: None of the presented techniques fulfill all requirements for clinical translation. The obvious way forward is to incorporate anatomical and functional imaging into a common hybrid-imaging platform. Antioxid. Redox Signal. 24, 939-958.


Figures

<b>FIG. 1.</b>
FIG. 1.
Spectrum of different ROS imaging techniques. In the upper part, different sources of ROS are shown: Mitochondria (mito), lipid peroxides (LPO), monoamine oxidase (MAO), nicotinamide adenine dinucleotide phosphate oxidase (NOX4 and NOX 1/2/5), xanthine oxidase (XO), and nitric oxide synthases (NOS and e-NOS). These result in different types of ROS [including superoxide radical (O2•−:), hydrogen peroxide (H2O2), hypoclorous acid (HOCl), peroxynitrite radical (ONOO:), nitric oxide(NO)] and ROS-induced modifications of GSH, NADPH, proteins, or glucose uptake, which, in turn, are detected by different imaging technologies (for abbreviations and details, see text). ROS, reactive oxygen species. To see this illustration in color, the reader is referred to the web version of this article at www.liebertpub.com/ars
<b>FIG. 2.</b>
FIG. 2.
Acoustic trauma induces NAD(P)H oxidation, lipid peroxidation, and loss of membrane fluidity. NAD(P)H can be excited by a one-photon process: For example, it can absorb one photon at 375 nm, and emit one photon at 430 nm. In the two-photon process, NAD(P)H absorbs two photons of 750 nm whose individual energy is about one half of the energy needed to excite that molecule. NAD(P)H does not emit fluorescence in its oxidized state. (A) Representative fluorescence NAD(P)H images at different time points (n = 5 animals per time point) after the trauma. (B) 4-HNE assays at different times after acoustic trauma. (C) Fluidity maps at different times after acoustic trauma. (D) Reduced NAD(P)H percentages at different times after the trauma. From the figure, the topologically differentiated NAD(P)H oxidation is also evident on the outer, middle, and inner rows of OHCs. (E) 4-HNE concentrations at different times after acoustic trauma. (F) GP values of hair bundle region (maximum of the GP profiles) at different times after the trauma. Adapted from Maulucci et al. (96). Reprinted with permission of Elsevier. NADPH, nicotinamide adenine dinucleotide phosphate. To see this illustration in color, the reader is referred to the web version of this article at www.liebertpub.com/ars
<b>FIG. 3.</b>
FIG. 3.
Examples of NPs adapted for ROS sensing. (A) Polymer-based NPs embedded with ROS sensing and reference fluorescent dyes; (B) Chemiluminescent NPs; (C) Metallic NP fluorescence quenching on oxidation of functionalized ROS-sensitive molecules (blue). Adapted from Uusitalo and Hempel (142). Reprinted with permission of MDPI. NP, nanoparticles. To see this illustration in color, the reader is referred to the web version of this article at www.liebertpub.com/ars
<b>FIG. 4.</b>
FIG. 4.
Age associated neuronal impairment of MC I activity in the brain of living monkeys. Typical MR and PET images of 18F-BCPP-EF in (A) normal young, (B) rotenone-treated young, and (C) normal old monkeys (Macaca mulatta). After infusion of vehicle (A, C) or rotenone at 0.1 mg/kg/h (B) for 1 h, PET scans were acquired for 91 min after 18F·BCPP-EF injection with sequential arterial blood sampling. The binding of 18F-BCPP-BF to MC-l was calculated using Logan graphical analysis with rnetabolite-corrected plasma input. Adapted from Tsukada et al. (139). Reprinted with permission of Springer. MRI, magnetic resonance imaging; PET, positron emission tomography. To see this illustration in color, the reader is referred to the web version of this article at www.liebertpub.com/ars
<b>FIG. 5.</b>
FIG. 5.
Redox reactions associated with EPR-visible species (spectra on the right). Top row. Nitroxides are stable in solutions, but not in biological systems, and can be sensors of redox status due to illustrated reactions. The basic structure can be the pyrrolidine or piperidine ring, which determines relative resistance to reduction (5-membered rings are generally more resistant). These two pairs: hydroxylamine/nitroxide and nitroxide/oxoamonium cation actually mimic cycling anti-oxidant and superoxide dismutase pairs. The group on the position 3 determines the behavior of the probe (solubility, lipophilicity, membrane penetration, in vivo clearance rate, etc.) and can be tailored to the needs. Middle row. Spin trapping. ROS are trapped with the nitrone trap converting them into a more stable form. Spectrum shows the ability of a trap DEPMPO (5-dietoxyphosphoryl-5-methyl-1-N-oxyde) to capture both superoxide and hydroxyl radicals that can be distinguished by characteristic spectral lines. Bottom row. Trapping of NO using DETC (diethyldithiocarbamate) or MGD (N-Methyl-D-glucamine dithiocarbamate) with different lipid solublility and membrane permeability. Adapted from Berliner and Fujii (7). Reprinted with permission of AAAS. EPR, electron paramagnetic resonance.
<b>FIG. 6.</b>
FIG. 6.
EPRI of rat brain. Left. The dynamic pattern of selected transversal EPR images of rat head 5 mm posterior to the bregma in the KA-treated and control groups at different times after injection of PCAM nitroxide. Right. Pharmacokinetic curves for brain regions. The cortical half-lives of PCAM in the control and KA groups were 18.0 ± 1.2 and 19.2 ± 0.7 min, whereas the hippocampal half-lives of PCAM in the control and KA groups were 10.4 ± 0.8 and 15.9 ± 0.7 min, respectively. Adapted from Yokoyama et al. (153). Reprinted with permission of Elsevier. KA, kainic-acid. To see this illustration in color, the reader is referred to the web version of this article at www.liebertpub.com/ars
<b>FIG. 7.</b>
FIG. 7.
EPRI of the thigh of mouse with implanted RIF-1 tumor. Left: Selected EPR images of clearance of 3CP nitroxide in untreated and BSO-induced (agent for glutathione synthesis) tumors. Middle: Redox mapping of the tumor. Two dimensional mapping of pseudo-first-order rate constants and frequency plot of 3CP reduction rate constants. Right: The semilog plot showing the whole tissue clearance of nitroxide in tumors and normal muscle of contra lateral leg. Images of tumor and muscle used for the measurement of pharmacokinetic data were collected simultaneously on the same animals. Adapted from Kuppusamy et al.(74). Reprinted with permission of AACR. To see this illustration in color, the reader is referred to the web version of this article at www.liebertpub.com/ars
<b>FIG. 8.</b>
FIG. 8.
Renderings of the superimposed 3D EPRI and 3D proton MRI of mice. The color map is for the EPR intensity of the 3CP nitroxide probe distribution. Left: Coronal MR image of mice. Right: Transverse slices through different organs of the animal showing the temporal change of EPR intensity of 3CP. The green contour depicts the ROI used to calculate the average EPR intensity distribution of the probe later used to assess pharmacokinetics. Based on that, it has been found that mice exposed to second-hand smoking have diminished ability to reduce nitroxides in these organs. Adapted from Caia et al. (15). Reprinted with permission of Elsevier. To see this illustration in color, the reader is referred to the web version of this article at www.liebertpub.com/ars
<b>FIG. 9.</b>
FIG. 9.
LPS treated rats. Left: T1W MRI images of the rat abdomen both before and after injection of the NO spin trap. Right: EPR spectra of trapped NO in-vivo on L-band (a) and on excised sample X-band (b), demonstrating that trapped radical is NO and that MRI signal enhancement originates from NO. Adapted from Gallez et al. (37). Reprinted with permission of Wiley.
<b>FIG. 10.</b>
FIG. 10.
Left: Interleaved (“EPR off” and “EPR on”) OMRI images (coronal) of bearing SCC tumor on the right hind leg, demonstrating the OE and the diagnostic quality achievable at this low magnetic field of 15 mT. The mouse was administered 3.8 mmol/kg triarymethyl radical by tail vein (72). Right: OMRI images of rat brain microinjected with neurodegenerative changes inducing agent (6-OHDA) into right hemisphere striatum. Redox status assessed 6 weeks later by the time-dependent OMRI signal of i.v.-injected methoxycarbonyl-PROXYL and the processed image showing the reduction rates in two hemispheres, demonstrating diminished reducing compatibilities in affected hemisphere. Adapted from Yamato et al. (147). Reprinted with permission of Elsevier. OE, overhauser enhancement. To see this illustration in color, the reader is referred to the web version of this article at www.liebertpub.com/ars

References

    1. Abbas K, Hardy M, Poulhès F, Karoui H, Tordo P, Ouari O, and Peyrot F. Detection of superoxide production in stimulated and unstimulated living cells using new cyclic nitrone spin traps. Free Radic Biol Med 71: 281–290, 2014 - PubMed
    1. Ahmad R, Caia G, Potter LC, Petryakov S, Kuppusamy P, and Zweier JL. In vivo multisite oximetry using EPR-NMR coimaging. J Magn Reson 207: 69–77, 2010 - PMC - PubMed
    1. Alecci M, Ferrari M, Quaresima V, Sotgiu A, and Ursini CL. Simultaneous 280 MHz EPR imaging of rat organs during nitroxide free radical clearance. Biophys J 67: 1274–1279, 1994 - PMC - PubMed
    1. Bacic G, Nilges MJ, Magin RL, Walczak T, and Swartz HM. In vivo localized ESR spectroscopy reflecting metabolism. Magn Reson Med 10: 266–272, 1989 - PubMed
    1. Ballinger JR. Imaging hypoxia in tumors. Semin Nucl Med 31: 321–329, 2001 - PubMed

Publication types

Substances