Thiamine Deficiency Increases Ca2+ Current and CaV1.2 L-type Ca2+ Channel Levels in Cerebellum Granular Neurons
- PMID: 27140189
- PMCID: PMC11482075
- DOI: 10.1007/s10571-016-0378-8
Thiamine Deficiency Increases Ca2+ Current and CaV1.2 L-type Ca2+ Channel Levels in Cerebellum Granular Neurons
Abstract
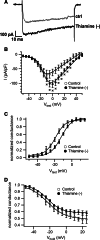
Thiamine (vitamin B1) is co-factor for three pivotal enzymes for glycolytic metabolism: pyruvate dehydrogenase, α-ketoglutarate dehydrogenase, and transketolase. Thiamine deficiency leads to neurodegeneration of several brain regions, especially the cerebellum. In addition, several neurodegenerative diseases are associated with impairments of glycolytic metabolism, including Alzheimer's disease. Therefore, understanding the link between dysfunction of the glycolytic pathway and neuronal death will be an important step to comprehend the mechanism and progression of neuronal degeneration as well as the development of new treatment for neurodegenerative states. Here, using an in vitro model to study the effects of thiamine deficiency on cerebellum granule neurons, we show an increase in Ca2+ current density and CaV1.2 expression. These results indicate a link between alterations in glycolytic metabolism and changes to Ca2+ dynamics, two factors that have been implicated in neurodegeneration.
Keywords: Ca2+ current; Cerebellum; Granular neuron; Neurodegeneration; Thiamine.
Conflict of interest statement
The authors declare that they have no conflict of interest.
Figures


Similar articles
-
Thiamine deficiency during pregnancy leads to cerebellar neuronal death in rat offspring: role of voltage-dependent K+ channels.Brain Res. 2007 Feb 23;1134(1):79-86. doi: 10.1016/j.brainres.2006.11.064. Epub 2007 Jan 2. Brain Res. 2007. PMID: 17196946
-
[Features of thiamine metabolism with vitamin B1 deficiency in hypokinesis].Vopr Pitan. 1989 Jul-Aug;(4):62-5. Vopr Pitan. 1989. PMID: 2815713 Russian.
-
Stac Proteins Suppress Ca2+-Dependent Inactivation of Neuronal l-type Ca2+ Channels.J Neurosci. 2018 Oct 24;38(43):9215-9227. doi: 10.1523/JNEUROSCI.0695-18.2018. Epub 2018 Sep 10. J Neurosci. 2018. PMID: 30201773 Free PMC article.
-
Calcium Signaling in Neurons and Glial Cells: Role of Cav1 channels.Neuroscience. 2019 Nov 21;421:95-111. doi: 10.1016/j.neuroscience.2019.09.041. Epub 2019 Oct 31. Neuroscience. 2019. PMID: 31678346 Review.
-
Modeling neurodegenerative disease pathophysiology in thiamine deficiency: consequences of impaired oxidative metabolism.Neurochem Int. 2011 Feb;58(3):248-60. doi: 10.1016/j.neuint.2010.11.019. Epub 2010 Dec 3. Neurochem Int. 2011. PMID: 21130821 Review.
Cited by
-
Protection of Cholinergic Neurons against Zinc Toxicity by Glial Cells in Thiamine-Deficient Media.Int J Mol Sci. 2021 Dec 11;22(24):13337. doi: 10.3390/ijms222413337. Int J Mol Sci. 2021. PMID: 34948135 Free PMC article.
-
Thiamine Deficiency Increases Intrinsic Excitability of Mouse Cerebellar Purkinje Cells.Cerebellum. 2021 Apr;20(2):186-202. doi: 10.1007/s12311-020-01202-x. Epub 2020 Oct 24. Cerebellum. 2021. PMID: 33098550
-
Developmental Aspects of Glucose and Calcium Availability on the Persistence of Memory Function Over the Lifespan.Front Aging Neurosci. 2019 Sep 11;11:253. doi: 10.3389/fnagi.2019.00253. eCollection 2019. Front Aging Neurosci. 2019. PMID: 31572169 Free PMC article. Review.
-
Altered Sodium and Potassium, but not Calcium Currents in Cerebellar Granule Cells in an In Vitro Model of Neuronal Injury.Cell Mol Neurobiol. 2017 Jul;37(5):771-782. doi: 10.1007/s10571-016-0416-6. Epub 2016 Aug 12. Cell Mol Neurobiol. 2017. PMID: 27517720 Free PMC article.
References
-
- Berridge M, Lipp P, Bootman M (1999) Calcium signalling. Curr Biol 9(5):R157–159 - PubMed
-
- Berridge MJ, Lipp P, Bootman MD (2000) The versatility and universality of calcium signalling. Nat Rev Mol Cell Biol 1(1):11–21. doi:10.1038/35036035 - PubMed
-
- Bootman MD, Lipp P, Berridge MJ (2001) The organisation and functions of local Ca(2+) signals. J Cell Sci 114(Pt 12):2213–2222 - PubMed
-
- Butterworth RF (1993) Pathophysiology of cerebellar dysfunction in the Wernicke-Korsakoff syndrome. Can J Neurol Sci 20(Suppl 3):S123–126 - PubMed
-
- Chadderton P, Schaefer AT, Williams SR, Margrie TW (2014) Sensory-evoked synaptic integration in cerebellar and cerebral cortical neurons. Nat Rev Neurosci 15(2):71–83. doi:10.1038/nrn3648 - PubMed
MeSH terms
Substances
LinkOut - more resources
Full Text Sources
Other Literature Sources
Miscellaneous

