. 2016 Jun 1;126(6):2151-66.
doi: 10.1172/JCI85782. Epub 2016 May 3.

Alternatively activated macrophages determine repair of the infarcted adult murine heart

Alternatively activated macrophages determine repair of the infarcted adult murine heart

Manabu Shiraishi et al. J Clin Invest. .

Abstract

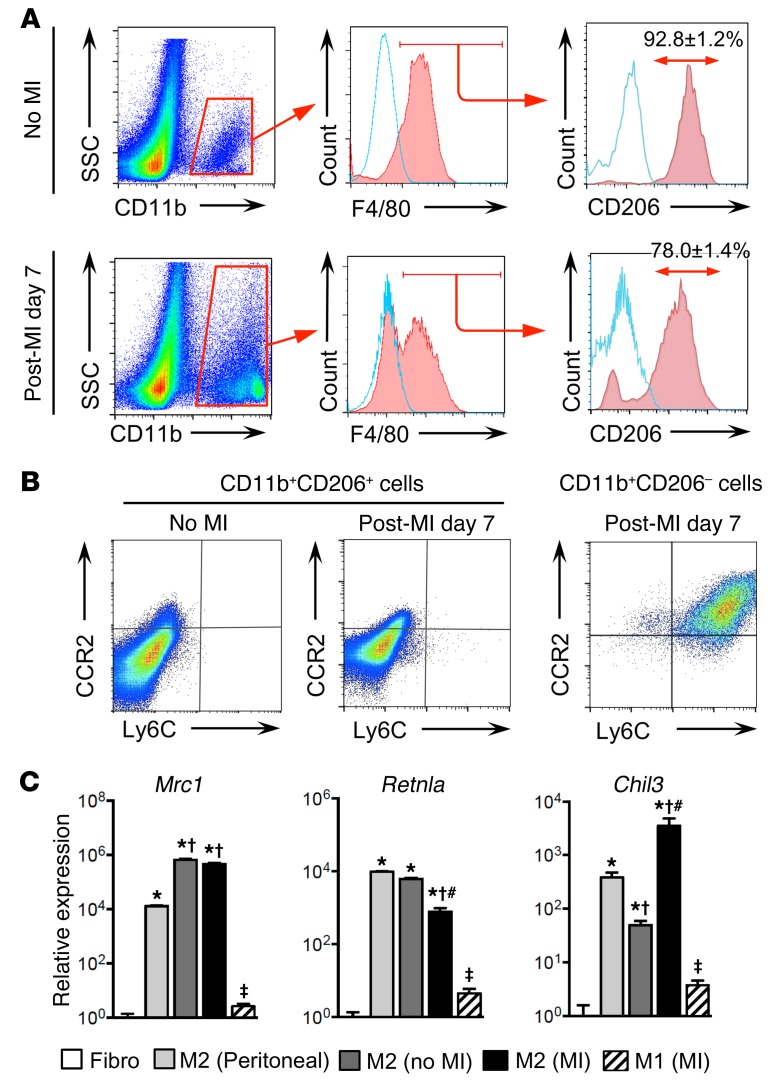
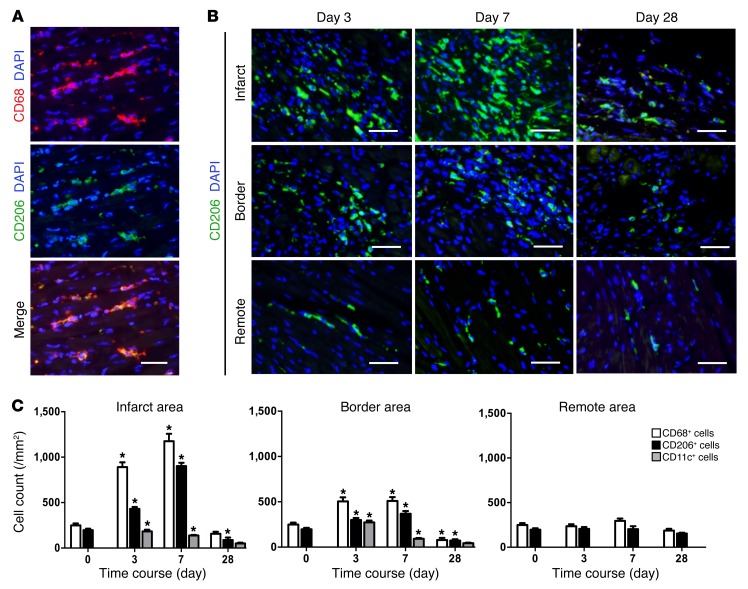
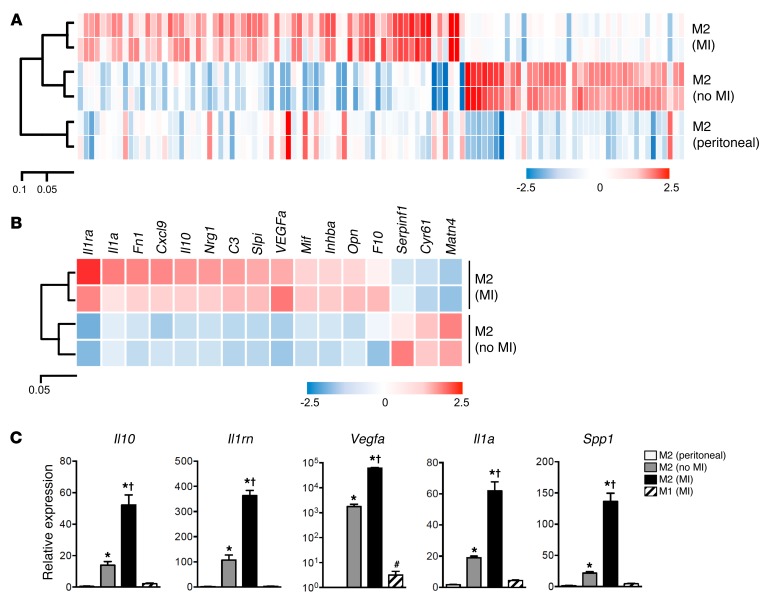
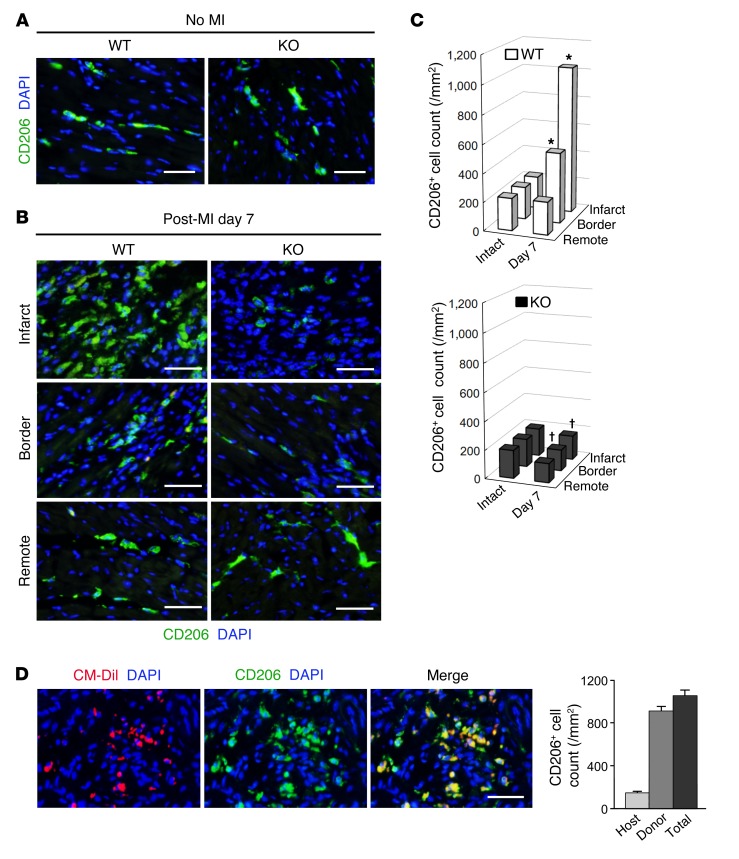
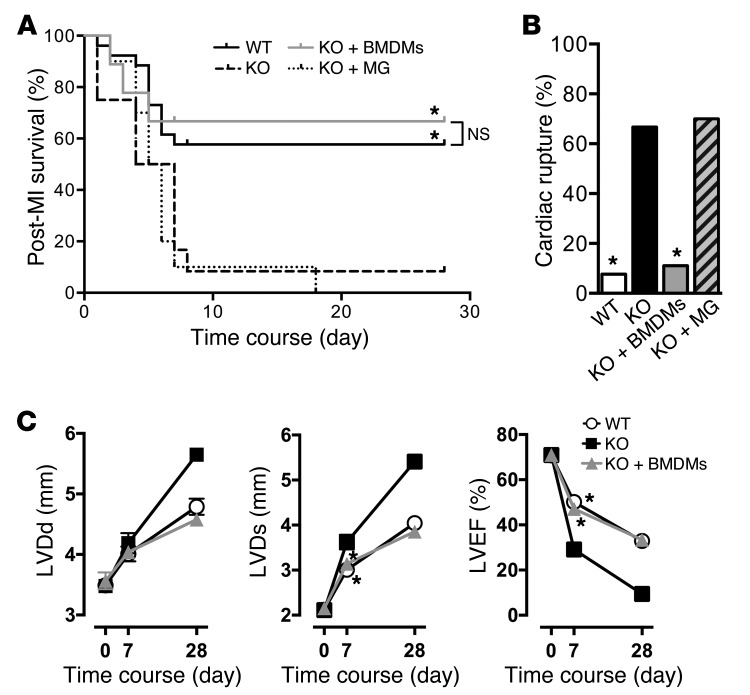
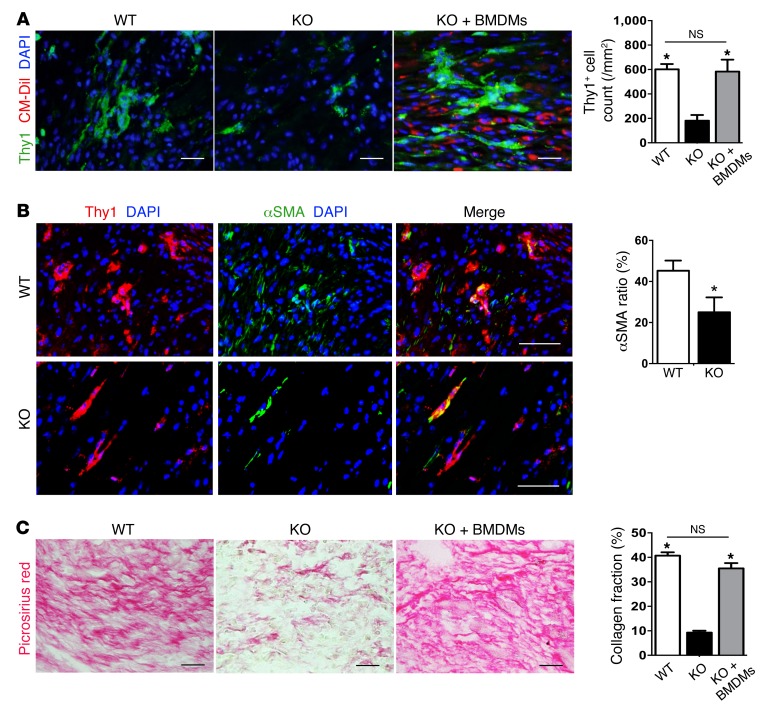
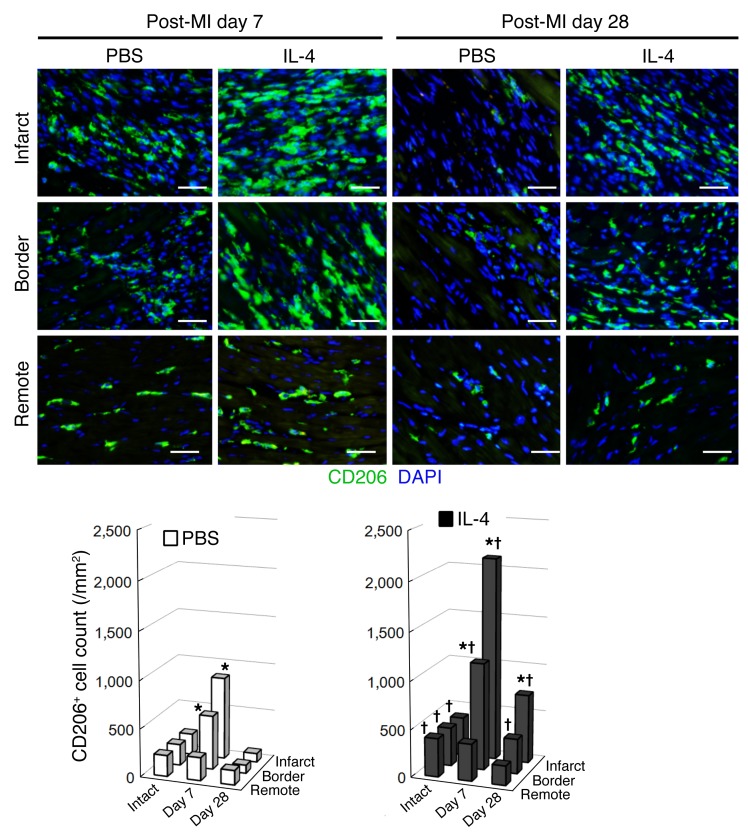
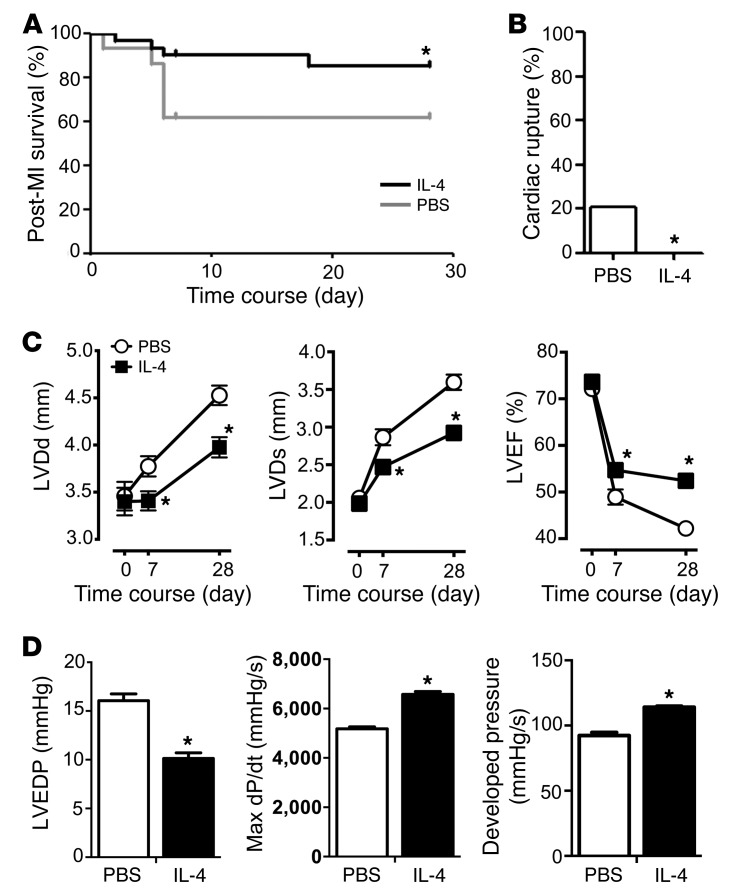
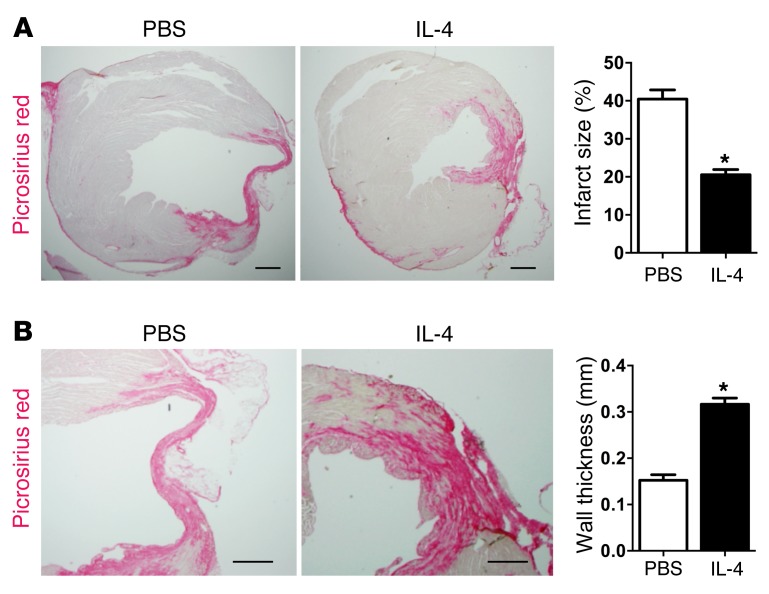
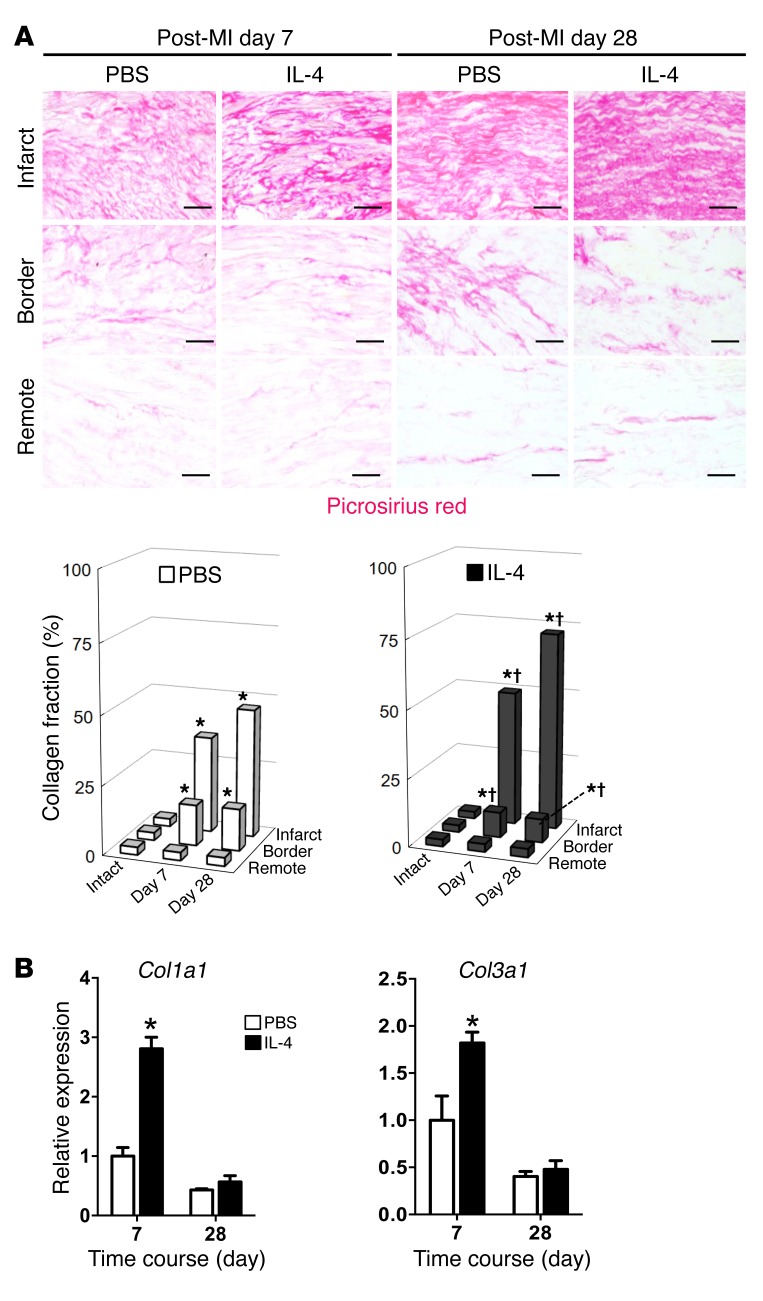
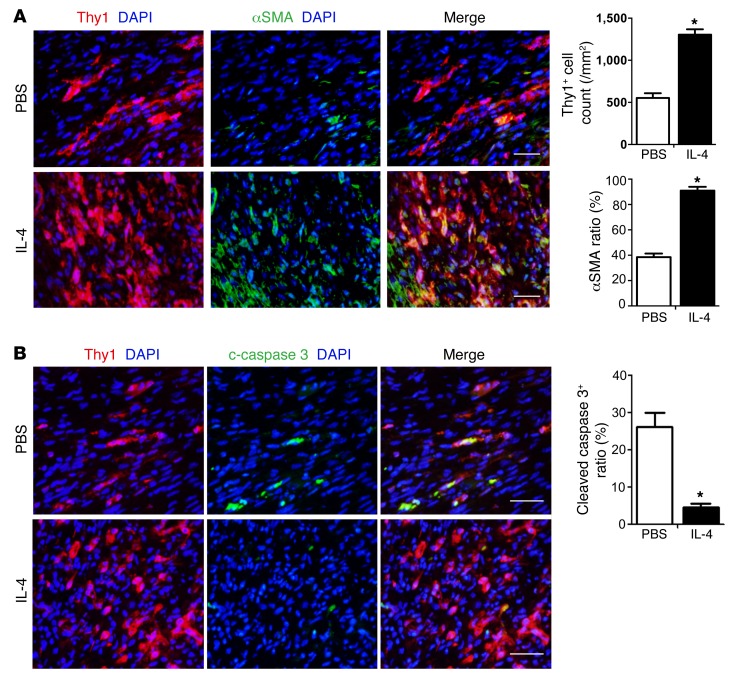
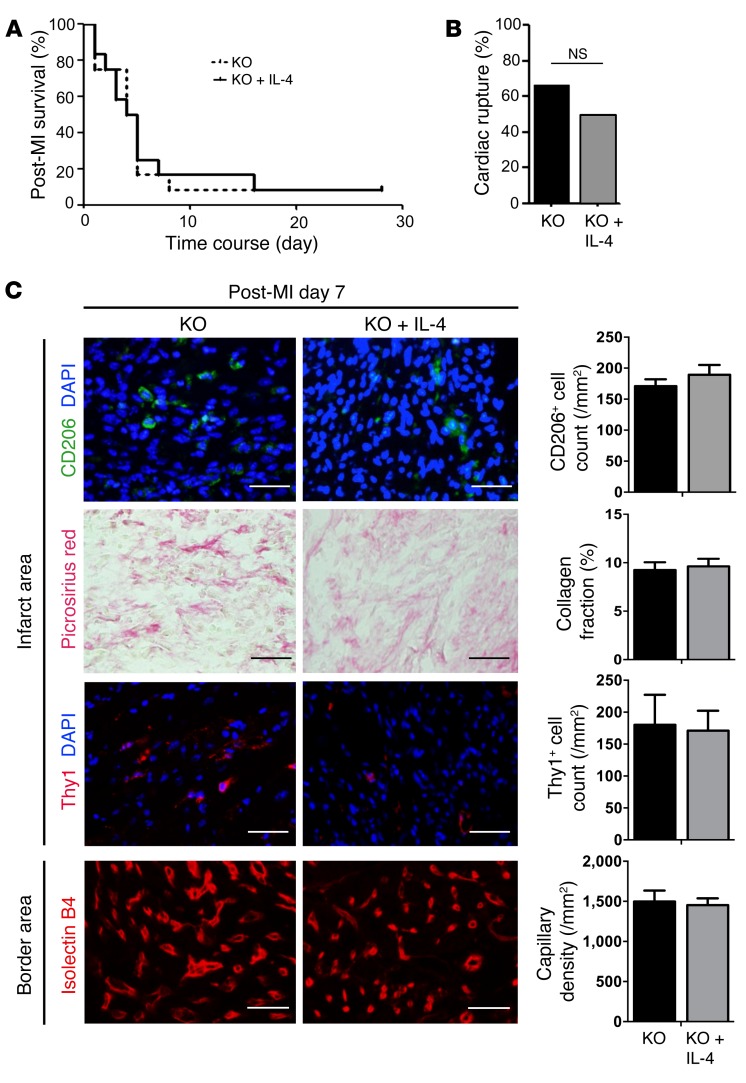
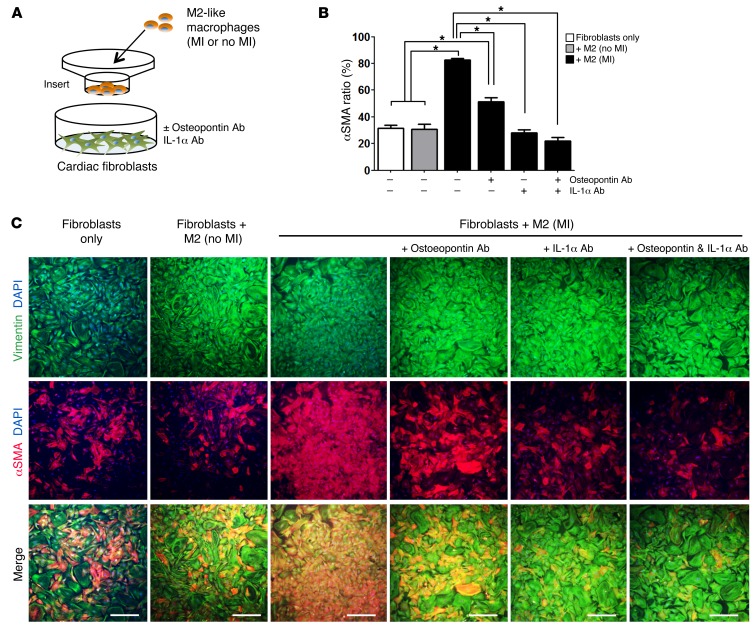
Alternatively activated (also known as M2) macrophages are involved in the repair of various types of organs. However, the contribution of M2 macrophages to cardiac repair after myocardial infarction (MI) remains to be fully characterized. Here, we identified CD206+F4/80+CD11b+ M2-like macrophages in the murine heart and demonstrated that this cell population predominantly increases in the infarct area and exhibits strengthened reparative abilities after MI. We evaluated mice lacking the kinase TRIB1 (Trib1-/-), which exhibit a selective depletion of M2 macrophages after MI. Compared with control animals, Trib1-/- mice had a catastrophic prognosis, with frequent cardiac rupture, as the result of markedly reduced collagen fibril formation in the infarct area due to impaired fibroblast activation. The decreased tissue repair observed in Trib1-/- mice was entirely rescued by an external supply of M2-like macrophages. Furthermore, IL-1α and osteopontin were suggested to be mediators of M2-like macrophage-induced fibroblast activation. In addition, IL-4 administration achieved a targeted increase in the number of M2-like macrophages and enhanced the post-MI prognosis of WT mice, corresponding with amplified fibroblast activation and formation of more supportive fibrous tissues in the infarcts. Together, these data demonstrate that M2-like macrophages critically determine the repair of infarcted adult murine heart by regulating fibroblast activation and suggest that IL-4 is a potential biological drug for treating MI.


Figures

Figure 1
Figure 1. M2-like macrophages were present in the adult murine heart.
(A) Flow cytometric analysis confirmed that CD206+F4/80+CD11b+ M2-like macrophages were present in normal, no-MI hearts and in day-7 post-MI hearts of adult C57BL/6 mice. More than 90% of F4/80+CD11b+ macrophages in normal hearts were positive for CD206, whereas the percentage of CD206+ cells in F4/80+CD11b+ macrophages was reduced to 78.0% ± 1.4% at day 7 after MI (n = 6 in each group; P < 0.01, 2-tailed, unpaired Student’s t test). Light blue lines indicate the IgG control data. (B) Most (92.7% ± 1.4% and 90.0% ± 2.6% in the no-MI hearts and day-7 post-MI hearts) of the CD11b+CD206+ cells were CCR2 and Ly6C, while 97.1% ± 1.0% of CD11b+CD206 cells were CCR2+ and LyC6+. Representative results of 6 different studies are presented. (C) CD206+F4/80+CD11b+ M2-like macrophages were collected by FACS from the peritoneal cavity of normal mice [M2 (Peritoneal)], from intact, no-MI hearts [M2 (no MI)], and from day-7 post-MI hearts [M2 (MI)] and subjected to real-time reverse transcription PCR (RT-PCR) analysis. CD11b+CD206 M1-like macrophages were also collected from day-7 post-MI hearts [M1 (MI)] and analyzed. Relative expression to that of cardiac fibroblasts (Fibro) is presented. M2-like macrophages from all 3 sources expressed the M2 macrophage markers Mrc1 (CD206), Retnla (Fizz1), and Chil3 (Ym1). n = 6 different mice in each group. *P < 0.05 versus both Fibro and M1 (MI); P < 0.05 versus M2 (Peritoneal); #P < 0.05 versus M2 (no MI); P < 0.05 versus Fibro; 1-way ANOVA.
Figure 2
Figure 2. Cardiac M2-like macrophages underwent post-MI area-specific changes.
(A) IHC confirmed the presence of CD206+ cells in the myocardial interstitium of normal mouse hearts, almost all of which (96.9% ± 2.0%; n = 6 different hearts) were also positive for CD68. Conversely, the majority (92.8% ± 3.0%; n = 6 different hearts) of CD68+ cells were CD206+. Nuclei were stained with DAPI. Scale bar: 50 μm. (B) Immunofluorescence revealed that the number of CD206+ M2-like macrophages was primarily increased in the infarct area (and in the border area to a lesser extent), with a post-MI peak on day 7. No change in the number of M2-like macrophages in the remote area was noted. Scale bars: 50 μm. (C) The post-MI chronological numbers of CD68+, CD206+, and CD11c+ cells in each infarct, border, or remote area were counted in the immunohistochemical samples described above. See Supplemental Figure 2 for representative images of immunostaining for CD68 and CD11c. n = 6 different hearts. *P < 0.05 versus day 0 (no MI, normal heart) in each cell type, repeated-measures ANOVA.
Figure 3
Figure 3. Cardiac M2-like macrophages strengthened their post-MI reparative ability.
(A) CD206+F4/80+CD11b+ M2-like macrophages were collected by FACS from intact hearts [M2 (no MI)], day-7 post-MI hearts [M2 (MI)], and from the peritoneal cavity of intact mice [(M2 (Peritoneal)] and subjected to microarray analysis. Macrophages from different origins showed distinct molecular signatures. M2 (MI) had a different expression profile from that of M2 (no MI), although both were clustered distinctly from the M2 (Peritoneal) profile. (B) Heatmap revealed that among the genes encoding secreted proteins, 13 genes were upregulated and 3 were downregulated in M2 (MI) compared with M2 (no MI) macrophages. The upregulated genes included antiinflammatory and repair-associated genes. (C) Quantitative RT-PCR (qRT-PCR) analysis confirmed the post-MI upregulation of these repair-associated genes in CD206+F4/80+CD11b+ cardiac M2-like macrophages [M2 (MI)]. CD11b+CD206 M1-like macrophages from day-7 post-MI hearts [M1 (MI)] expressed these genes at lower levels. Expression levels relative to those of M2 (Peritoneal) are presented. n = 6 in each group. *P < 0.05 versus both M2 (Peritoneal) and M1 (MI); P < 0.05 versus M2 (no MI); #P < 0.05 versus M2 (Peritoneal); 1-way ANOVA.
Figure 4
Figure 4. Post-MI increase in M2-like macrophages was abolished in Trib1–/– mice.
(A) IHC indicated that the presence of CD206+ M2-like macrophages in intact, no-MI hearts in the KO group (Trib1–/– mice) was similar to that seen in the WT littermates group. n = 6 hearts in each group. Scale bars: 50 μm. (B) The increased number of CD206+ M2-like macrophages on day 7 after MI in the infarct and border areas of the WT group hearts (n = 6) was completely eliminated in the KO group hearts (n = 5). Scale bars: 50 μm. (C) The numbers of CD206+ cells were serially counted in each area. It was evident that the post-MI increase in CD206+ M2-like macrophage numbers in the damaged myocardium was abolished in Trib1–/– mice. n = 5–6 for each point in each group. *P < 0.05 versus intact, no-MI hearts in each group; P < 0.05 versus the WT group at the corresponding time and area; repeated-measures ANOVA. (D) On day 7 after BMDM transplantation (WT mice derived and labeled with CM-DiI) into KO (Trib1–/–) mice with MI, the frequency of CD206+ M2-like macrophages in the infarct area was recovered to a degree similar to that in the WT group (see Figure 4, B and C). Most of the CD206+ M2 macrophages originated from the donor cells (Host, CD206+CM-DiI cells; Donor, CD206+CM-DiI+ cells). Scale bar: 50 μm. n = 6 hearts.
Figure 5
Figure 5. Depletion of the post-MI increase in M2-like macrophages in Trib1–/– mice resulted in a critically deteriorated prognosis.
(A) The post-MI survival of mice was dramatically reduced in the KO group (Trib1–/– mice; n = 12) compared with that of the WT group (WT littermates; n = 26), but this effect was fully reversed by transplanting BMDMs in Matrigel (KO plus BMDMs group, n = 10). The control transplantation (KO plus Matrigel group; injection of Matrigel only, n = 10) did not affect the survival rates of the KO group. *P < 0.05 versus both KO and KO plus Matrigel groups, log-rank test. (B) The cardiac rupture rate over a 28-day post-MI period was increased by 9-fold in the KO group compared with the rupture rate in the WT group. This fatal event was prevented in the KO plus BMDMs group. The control transplantation (KO plus Matrigel group) did not influence the cardiac rupture rate in the KO group. n = the same as in A in each group. P < 0.05 versus both the KO and KO plus Matrigel groups, χ2 test. (C) Echocardiographic analysis revealed exacerbated cardiac dysfunction in the KO group, while this deterioration was ameliorated in the KO plus BMDMs group. n (day 0, day, 7, and day 28) = 12, 10, and 10 in the WT group; 12, 5, and 1 in the KO group; and 10, 6, and 6 in the KO plus BMDMs group. *P < 0.05 versus the corresponding time point for the KO group, repeated-measures ANOVA. (Note that the day-28 data were not included in the calculation, because n = 1 in the KO group; Trib1–/– mice rarely survived for 28 days after MI.) LVDd, LV end-diastolic dimension; LVDs, LV end-systolic dimension; LVEF, LV ejection fraction; MG, Matrigel. See Supplemental Table 1 for more detailed echocardiographic data.
Figure 6
Figure 6. Depletion of M2-like macrophages in Trib1–/– mice led to impaired fibroblast-mediated repair of the infarcted myocardium.
(A) IHC demonstrated that the accumulation of Thy1+ fibroblasts in the infarct area at day 7 after MI was largely inhibited in the KO group (n = 5) compared with that seen in the WT group (n = 6). This deficiency in Trib1–/– mice was reversed by BMDM transplantation (KO plus BMDMs group; n = 6). BMDMs were prelabeled with CM-DiI. Scale bars: 50 μm. *P < 0.05 versus the KO group, 1-way ANOVA. (B) Staining for Thy1 and αSMA in the infarct area on post-MI day 7 indicated that the ratio of αSMA+ fibroblasts (percentage of Thy1+αSMA+ myofibroblasts/percentage of Thy1+ fibroblasts) was reduced in the KO group. Scale bars: 50 μm. n = 5 (KO group) and 6 (WT group). *P < 0.05 versus the WT group, 2-tailed, unpaired Student’s t test. (C) Picrosirius red staining showed that the amount (collagen volume fraction) and alignment of collagen fibers in the infarct area on post-MI day 7 was markedly reduced in the KO group (n = 5) compared with that seen in the WT group (n = 6). See Supplemental Figure 10 for additional data in other areas. This impaired tissue repair was reversed in the KO plus BMDMs group (n = 6). *P < 0.05 versus the KO group, 1-way ANOVA. Scale bars: 50 μm.
Figure 7
Figure 7. IL-4 administration amplified the post-MI augmentation of cardiac M2-like macrophages in damaged myocardium.
Immunofluorescence revealed that the post-MI augmentation of CD206+ M2-like macrophages in the border and infarct areas of the PBS-injected group (n = 6 in each point) was further amplified in the IL-4–treated group (n = 6 in each point). Scale bars: 50 μm. *P < 0.05 versus intact, no-MI hearts in each group; P < 0.05 versus PBS-treated group at the corresponding time and area; repeated-measures ANOVA.
Figure 8
Figure 8. IL-4 treatment improved post-MI prognosis and cardiac function.
(A) Post-MI survival rates of the mice were improved in the IL-4–treated group (n = 31) compared with those of the PBS-treated group (n = 29). *P < 0.05 versus the PBS-treated group, log-rank test. (B) The cardiac rupture rate over a 28-day post-MI period was reduced in the IL-4–treated group (n = 31) compared with that of the PBS-treated group (n = 29). *P < 0.05 versus the PBS-treated group, χ2 test. (C) Echocardiographic analysis revealed that the IL-4–treated group showed improved cardiac function and attenuated ventricular dilatation compared with the PBS-treated group. n = 12 for each point in each group. *P < 0.05 versus the PBS-treated group at the corresponding time point, repeated-measures ANOVA. See Supplemental Table 2 for additional pre- and post-MI echocardiographic data. (D) Cardiac catheterization assessments detected improved hemodynamics and enhanced cardiac performance at day 28 after MI in the IL-4–treated group (n = 10) compared with the PBS-treated group (n = 10). *P < 0.05 versus the PBS-treated group, 2-tailed, unpaired Student’s t test. See Supplemental Table 3 for more detailed data. dP/dt, LV contractility; LVEDP, LV end-diastolic pressure; Max, maximum.
Figure 9
Figure 9. IL-4 treatment reduced infarct size and increased infarcted wall thickness.
Picrosirius red staining of day-28 post-MI heart samples indicated that the infarct size was reduced (A) and the thickness of the walls of the infarct area was increased (B) in the IL-4–treated group compared with the PBS–treated group. Scale bars: 1 mm. n = 6 in each group. *P < 0.05 versus the PBS-treated group, 2-tailed, unpaired Student’s t test.
Figure 10
Figure 10. IL-4 treatment enhanced the formation of connective tissue in the infarct area.
(A) Picrosirius red staining revealed that formation of fibrotic tissues in the infarct area was increased in the IL-4–treated group compared with that seen in the PBS-treated group. Results in the graphs are presented as the collagen volume fraction (percentage). In contrast, extracellular collagen deposition in the remote and border areas was unchanged or attenuated in the IL-4–treated group. For images of the intact, no-MI hearts, see Supplemental Figure 15. Scale bars: 100 μm. n = 6 for each point in each group. *P < 0.05 versus the intact, no-MI hearts in each group; P < 0.05 versus the WT group at the corresponding time and area; repeated-measures ANOVA. (B) qRT-PCR indicated that the expression of collagen genes was upregulated in the hearts of the IL-4–treated group at post-MI day 7 but not day 28 compared with the PBS-treated group. n = 6 for each point in each group. *P < 0.05 versus the corresponding time point of the PBS-treated group, repeated-measures ANOVA.
Figure 11
Figure 11. IL-4 treatment increased the post-MI number and activation of cardiac fibroblasts, with attenuated apoptosis.
(A) IHC demonstrated that the number and activation (transformation into Thy1+αSMA+ myofibroblasts) of Thy1+ cardiac fibroblasts in the infarct area of the IL-4–treated group were increased at post-MI day 7 compared with the PBS-treated group. Scale bars: 50 μm. αSMA ratio is the percentage of αSMA+Thy1+ myofibroblasts to the percentage of Thy1+ fibroblasts. n = 6 different hearts in each group. *P < 0.05 versus the PBS-treated group, 2-tailed, unpaired Student’s t test. See Supplemental Figure 7 for additional data in other areas and at other time points. (B) Double immunofluorescence staining for Thy1 and cleaved caspase 3 demonstrated that apoptosis of cardiac fibroblasts in the infarct area of the IL-4–treated group was attenuated at post-MI day 7 compared with the PBS-treated group. Scale bars: 50 μm. n = 6 in each group. *P < 0.05 versus the PBS-treated group, 2-tailed, unpaired Student’s t test.
Figure 12
Figure 12. IL-4–induced myocardial repair was abolished in Trib1–/– mice.
(A) The post-MI survival rate of Trib1–/– mice (KO group) was not improved following IL-4 treatment (KO plus IL-4–treated group). n = 12 in each group; log-rank test. (B) The cardiac rupture rate over a 28-day post-MI period was not significantly changed between the KO and KO plus IL-4–treated groups. n = 12 in each group; χ2 test. (C) Histological studies showed that the frequency of CD206+ M2-like macrophages, collagen fiber formation, and accumulation of Thy1+ fibroblasts in the infarct area and the density of isolectin B4+ capillary vessels in the border area at post-MI day 7 were equivalent between the KO and KO plus IL-4–treated groups. Scale bars: 50 μm. n = 3 in each group; 2-tailed, unpaired Student’s t test.
Figure 13
Figure 13. IL-1α and osteopontin played a vital role in cardiac M2-like macrophage–induced fibroblast activation.
(A) Schematic of the coculture experimental protocol. Primary cardiac fibroblasts were cocultured with or without CD206+F4/80+CD11b+ M2-like macrophages from intact, no-MI or MI (day 7 after MI) hearts in the Boyden chamber culture system for 48 hours. Neutralizing Abs against osteopontin and/or IL-1α were added to the relevant groups at the beginning of the coculture with M2-like macrophages. (B) Activation of cardiac fibroblasts (ratio of vimentin+αSMA+ myofibroblasts to vimentin+ fibroblasts) was increased in the cocultures with M2 (MI) macrophages but not with M2 (no MI) macrophages. Representative images are presented in C. This increased activation was eliminated by neutralizing Abs against osteopontin and IL-1α. n = 8–10 in each group. *P < 0.05, 1-way ANOVA. (C) Representative images of immunocytochemical staining for vimentin and αSMA. Nuclei were counterstained with DAPI. Scale bars: 200 μm.

References

    1. van den Borne SW, Diez J, Blankesteijn WM, Verjans J, Hofstra L, Narula J. Myocardial remodeling after infarction: the role of myofibroblasts. Nat Rev Cardiol. 2010;7(1):30–37. doi: 10.1038/nrcardio.2009.199. - DOI - PubMed
    1. Shinde AV, Frangogiannis NG. Fibroblasts in myocardial infarction: a role in inflammation and repair. J Mol Cell Cardiol. 2014;70:74–82. doi: 10.1016/j.yjmcc.2013.11.015. - DOI - PMC - PubMed
    1. Porrello ER, et al. Transient regenerative potential of the neonatal mouse heart. Science. 2011;331(6020):1078–1080. doi: 10.1126/science.1200708. - DOI - PMC - PubMed
    1. Gordon S, Martinez FO. Alternative activation of macrophages: mechanism and functions. Immunity. 2010;32(5):593–604. doi: 10.1016/j.immuni.2010.05.007. - DOI - PubMed
    1. Wang G, et al. HDAC inhibition prevents white matter injury by modulating microglia/macrophage polarization through the GSK3β/PTEN/Akt axis. Proc Natl Acad Sci U S A. 2015;112(9):2853–2858. doi: 10.1073/pnas.1501441112. - DOI - PMC - PubMed

MeSH terms

Substances