. 2016 May 17;113(20):E2766-75.
doi: 10.1073/pnas.1513023113. Epub 2016 May 2.

Functional evolution of IGF2:IGF2R domain 11 binding generates novel structural interactions and a specific IGF2 antagonist

Affiliations

Functional evolution of IGF2:IGF2R domain 11 binding generates novel structural interactions and a specific IGF2 antagonist

Susana Frago et al. Proc Natl Acad Sci U S A. .

Abstract

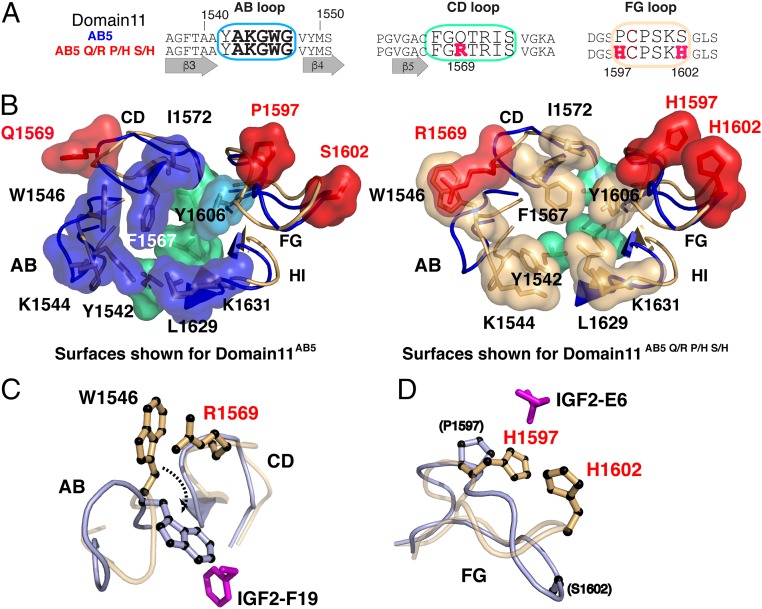
Among the 15 extracellular domains of the mannose 6-phosphate/insulin-like growth factor-2 receptor (M6P/IGF2R), domain 11 has evolved a binding site for IGF2 to negatively regulate ligand bioavailability and mammalian growth. Despite the highly evolved structural loops of the IGF2:domain 11 binding site, affinity-enhancing AB loop mutations suggest that binding is modifiable. Here we examine the extent to which IGF2:domain 11 affinity, and its specificity over IGF1, can be enhanced, and we examine the structural basis of the mechanistic and functional consequences. Domain 11 binding loop mutants were selected by yeast surface display combined with high-resolution structure-based predictions, and validated by surface plasmon resonance. We discovered previously unidentified mutations in the ligand-interacting surface binding loops (AB, CD, FG, and HI). Five combined mutations increased rigidity of the AB loop, as confirmed by NMR. When added to three independently identified CD and FG loop mutations that reduced the koff value by twofold, these mutations resulted in an overall selective 100-fold improvement in affinity. The structural basis of the evolved affinity was improved shape complementarity established by interloop (AB-CD) and intraloop (FG-FG) side chain interactions. The high affinity of the combinatorial domain 11 Fc fusion proteins functioned as ligand-soluble antagonists or traps that depleted pathological IGF2 isoforms from serum and abrogated IGF2-dependent signaling in vivo. An evolved and reengineered high-specificity M6P/IGF2R domain 11 binding site for IGF2 may improve therapeutic targeting of the frequent IGF2 gain of function observed in human cancer.

Keywords: binding kinetics; biological therapy; growth factor receptor; insulin-like growth factor 2; protein evolution.


Conflict of interest statement

The authors declare no conflict of interest.

Figures

Fig. 1.
Fig. 1.
Sequence and structure of the IGF2 binding site of domain 11 and in vitro forward evolution. (A, Left) Ribbon representation of the solution structure of the complex between domain 11AB3 (gray) and IGF2 (pink). Surface representations are shown for the AB (blue), CD (green), FG (yellow), and HI (dark pink) loops. (A, Right) Close-up of the IGF2-binding site and interacting loops of domain 11AB3 and the main three-pronged interaction involving T16, F19, and L53 of IGF2. (B) Sequence of domain 11 secondary structure and binding loops. Mutations of domain 11WT and their effects on affinity for IGF2 are shown below the sequences. (C) Strategy for forward evolution. Mutant library generated by combining random mutagenesis in P. pastoris yeast surface display with flow cytometry screen (green) after validation of biotin-IGF2 binding to Flag tag domain 11 protein on the yeast surface. Mutant clones are selected using a high-throughput SPR screen and, with NMR informed site-directed mutagenesis (purple), further validated (yellow) for IGF2 sensitivity and specificity using high-sensitivity SPR of purified recombinant protein.
Fig. 2.
Fig. 2.
Comparison of domain 11WT, domain 11AB3, and domain 11AB5 high-resolution structures. (A) Sequence comparison of the AB loop from domain 11WT and mutants. (B) High-resolution NMR structural ensembles of the lowest twenty energy models for free domain11AB5 (dark blue; PDB ID code 2M6T) and bound to IGF2 (light blue; PDB ID code 2M68). Structural statistics are provided in in SI Appendix, Table S4. (C) Key residues of the free forms (dark gray) of domain 11AB3 (Left; PDB ID code 2L2A) and domain 11AB5 (dark blue; Right) and corresponding IGF2- bound forms of domain 11AB3 (light gray; PDB ID code 2L29) and domain 11AB5 (light blue). In domain 11AB5 W1546 closes into IGF2 F19 (pink, modeled from 2L29), whereas in domain 11AB3, G1546 (highlighted by red arrow) moves outward and indicates the large conformational change of the AB loop on complexation. (D) Lipari–Szabo model-free S2 parameters showing flexible AB, BC, and CD loops for domain 11WT, shown by S2 values <0.7. These loop regions are more rigid in domain 11AB5, consistent with NOE, R1, and R2 data (SI Appendix, Figs. S1–S4).
Fig. 3.
Fig. 3.
Effects of single and combined mutations of the IGF2-binding site in human domain 11AB3 and domain 11AB5. (A) Heat map of IGF2 binding to single loop point mutants on domain 11AB5 (Left) and domain 11AB3 (Right) backgrounds. (Upper) koff. (Lower) KD. The scale is log2 of the domain 11reference/domain 11mutant ratio, where domain 11reference is either domain 11AB5 or domain 11AB3. The reference value is shown in green, the increase in affinity (i.e., decrease in KD or koff) is shown in red, and the decrease in affinity (i.e., increase in KD or koff) is shown in blue. (B) Effect of combinations of loop mutants on IGF2 koff compared with domain 11AB3. (C) Effect of combined loop mutants on IGF2-binding free energy (ΔG°) compared with domain 11AB3. ΔΔG° is calculated as ΔΔG° = ΔG° domain 11mutant − ΔG° domain 11AB3 = RTln (KD domain 11mutant/KD domain 11AB3). Additive and nonadditive contributions of single point mutations are shown with a boxed solid line and dashed line, respectively. Raw data are provided in SI Appendix, Tables S2, S5, and S6. (D) Thermodynamic profiles of the IGF2 binding of domain 11 mutants. Data fitting of the temperature dependence of the dissociation constant according to the van’t Hoff equation is shown. (E) Comparison of koff between domain 11AB3 and domain 11AB5 with combined mutations.
Fig. 4.
Fig. 4.
Comparison of domain 11AB5 and domain 11AB5-Q1569R P1597H S1602H high-resolution structures. (A) Sequence comparison of the AB, CD, and FG loop from domain 11AB5-Q1569R P1597H S1602H and domain 11AB5. (B) Superposition of free domain 11AB5 (blue loops) and domain 11AB5-Q1569R P1597H S1602H (gold loops) with residue surfaces shown for domain 11AB5 (Left) and domain 11AB5-Q1569R P1597H S1602H (Right). Hydrophobes within or surrounding the binding site are shown in blue (domain 11AB5) or gold (domain 11AB5-Q1569R P1597H S1602H) with underlying foundation residues in green (V1574, L1629, and L1636). The mutation Q/R 1569, P/H 1597, and S/H 1602 surfaces are shaded in red. (C and D) Comparison of the AB and CD loop orientation (C) and the FG loop (D) between the free form of domain 11AB5-Q1569R P1597H S1602H (orange) and domain11AB5 in the IGF2-bound form (light blue). The reorientation of W1546 required for domain 11AB5-Q1569R P1597H S1602H to achieve the same bound conformation is highlighted by the dashed arrow in C.
Fig. 5.
Fig. 5.
Fc domain 11AB5/AB5-RHH binds IGF2 isoforms with high affinity and selectivity. (A) SPR sensorgrams of the interactions among Fc domain 11AB5, Fc domain 11AB5-RHH, and Fc domain 11I1572A (control non-IGF2 binding) with IGF1 (red), IGF21–67, IGF21–104, and IGF21–156. Recombinant IGF1 and the different IGF2 forms were injected at concentrations ranging from 64 nM to 0.25 nM over Fc domain 11AB5 immobilized on a CM5 surface by antibody capture. (B) Fc domain 11AB5 or Fc domain 11I1572A pull-down assay of different recombinant IGF2 isoforms. (C) Fc domain 11 pull-down assay as in B of the different IGF2 isoforms produced by tumor cell lines. Supernatants of the HCC cell lines Hep3B and Huh7 and of the NIH 3T3 control cell line expressing pro-IGF2R104A were incubated with Fc domain 11AB5 or with Fc domain 11I1572A as a control.
Fig. 6.
Fig. 6.
Fc domain 11AB5 and Fc domain 11AB5-RHH (IGF2-TRAP) inhibit IGF2 signaling in vivo. (A) Fc domain 11AB5 and Fc domain 11AB5-RHH (IGF2-TRAP) abrogate an IGF21–67-induced hypoglycemia in a mouse model. Mice were anesthetized (t = −30 min), and blood glucose levels were allowed to stabilize for 30 min (expressed relative to this blood glucose level). Subsequently (t = 0 min), the mice received 1 mg kg-1 IGF21–67 alone (n = 4), or premixed with Fc domain 11AB5 or Fc domain 11AB5 RHH at a molar ratio of 1:1 (n = 3) (P = 0.0133, two-way ANOVA with Bonferroni post-test) or 1:0.5 (n = 3) (P = 0.0023, two-way ANOVA with Bonferroni post-test), respectively. With a molar ratio of 1:0.23, Fc domain 11AB5 RHH is a more efficient IGF2 antagonist than Fc domain 11AB5 (P = 0.0026, two-way ANOVA with Bonferroni post-test). (B) IGF2-TRAP reduces IGF2-dependent xenograft growth (SKNMC-IGF21–67). There were 5 × 10⁶ cells per injection site in CD-1 nude mice, with a single infused concentration of IGF2-TRAP (40 mg kg−1 per week) (green; n = 7; n = 2 injection error, n = 1 unexplained death) or PBS control (blue; n = 10). (P = 0.002, Wilcoxon test across all time points). (C) IGF2-TRAP administration resulted in reduced levels of serum IGF2 independent of IGF1, GH, and IGFBP level (day 28; control PBS, n = 10 out of 10; IGF2-TRAP, n = 6 out of 7). (D) Oncology drug synergistic screen in SKNMC-FLAG-IGF2104 with IGF2-TRAP. Heat maps show top-ranked drugs (30 shown; blue for synergy, red for antagonism) with low P values (RP method) of the interaction score at 1 µM and the IGF2-TRAP (three replicates, R1–R3). (E) Validation dose–response curves for PI3kinase inhibitors (PF-04691502 and pictilisib) in the presence (green) and absence (blue) of the IGF2-TRAP. IC50 values are shown. A leftward shift indicates synergism (P < 0.0001 comparing the IC50 of drug alone vs. drug + IGF2-TRAP, F test). Asterisks indicate the concentrations at which synergistic interactions occur (Q >1.15). (F) IGF2-TRAP modifies the molecular distribution of IGF2 in human serum. Normal (Left) and NICTH (Right) serum samples were fractionated in a gel filtration column at neutral pH, alongside a molecular weight calibration marker, before and after incubation and depletion with IGF2-TRAP–loaded protein G beads. Elution fractions were evaluated by Western blot analysis.

References

    1. Harms MJ, Thornton JW. Evolutionary biochemistry: Revealing the historical and physical causes of protein properties. Nat Rev Genet. 2013;14(8):559–571. - PMC - PubMed
    1. Williams C, et al. An exon splice enhancer primes IGF2:IGF2R binding site structure and function evolution. Science. 2012;338(6111):1209–1213. - PMC - PubMed
    1. Ghosh P, Dahms NM, Kornfeld S. Mannose 6-phosphate receptors: New twists in the tale. Nat Rev Mol Cell Biol. 2003;4(3):202–212. - PubMed
    1. Linnell J, Groeger G, Hassan AB. Real time kinetics of insulin-like growth factor II (IGF-II) interaction with the IGF-II/mannose 6-phosphate receptor: The effects of domain 13 and pH. J Biol Chem. 2001;276(26):23986–23991. - PubMed
    1. Morgan DO, et al. Insulin-like growth factor II receptor as a multifunctional binding protein. Nature. 1987;329(6137):301–307. - PubMed

Publication types

Substances

LinkOut - more resources