. 2016 May 17;113(20):5610-5.
doi: 10.1073/pnas.1600163113. Epub 2016 May 2.

DNA-based nanoparticle tension sensors reveal that T-cell receptors transmit defined pN forces to their antigens for enhanced fidelity

Affiliations

DNA-based nanoparticle tension sensors reveal that T-cell receptors transmit defined pN forces to their antigens for enhanced fidelity

Yang Liu et al. Proc Natl Acad Sci U S A. .

Abstract

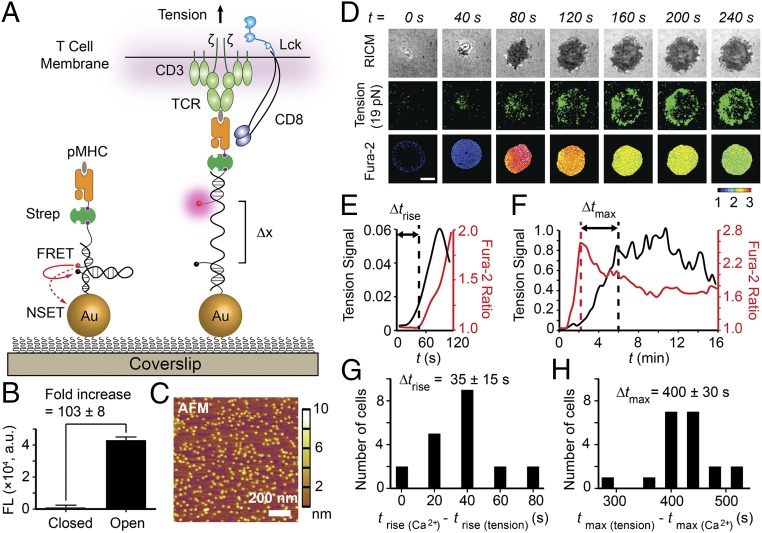
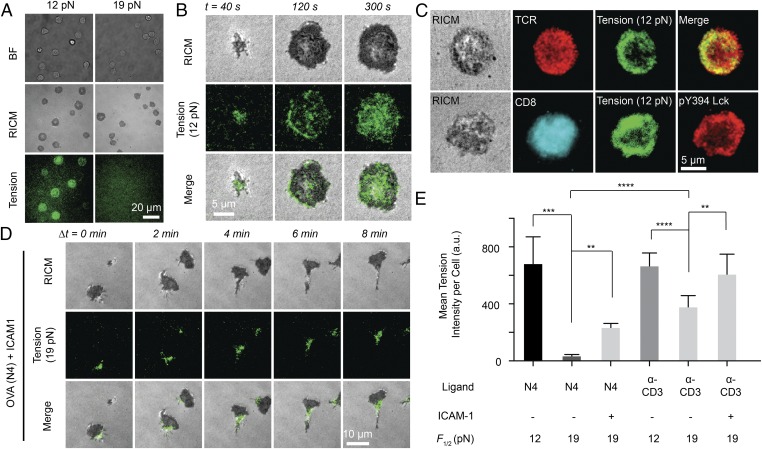
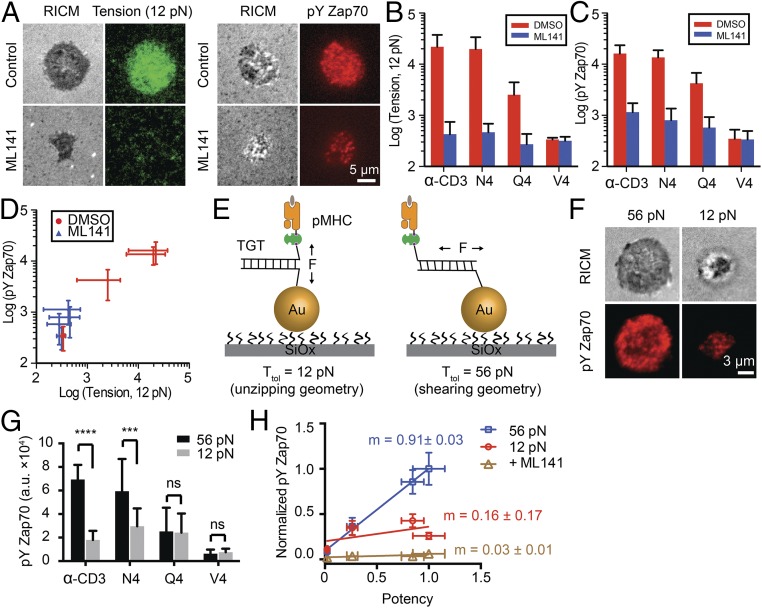
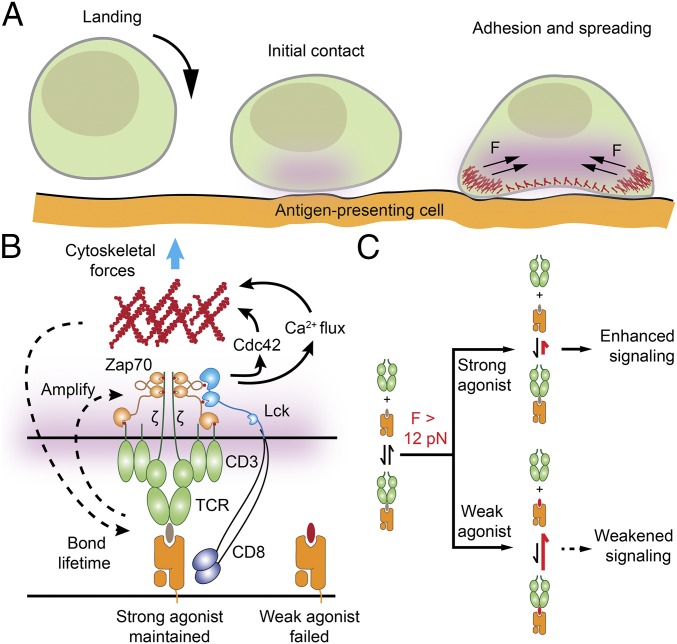
T cells are triggered when the T-cell receptor (TCR) encounters its antigenic ligand, the peptide-major histocompatibility complex (pMHC), on the surface of antigen presenting cells (APCs). Because T cells are highly migratory and antigen recognition occurs at an intermembrane junction where the T cell physically contacts the APC, there are long-standing questions of whether T cells transmit defined forces to their TCR complex and whether chemomechanical coupling influences immune function. Here we develop DNA-based gold nanoparticle tension sensors to provide, to our knowledge, the first pN tension maps of individual TCR-pMHC complexes during T-cell activation. We show that naïve T cells harness cytoskeletal coupling to transmit 12-19 pN of force to their TCRs within seconds of ligand binding and preceding initial calcium signaling. CD8 coreceptor binding and lymphocyte-specific kinase signaling are required for antigen-mediated cell spreading and force generation. Lymphocyte function-associated antigen 1 (LFA-1) mediated adhesion modulates TCR-pMHC tension by intensifying its magnitude to values >19 pN and spatially reorganizes the location of TCR forces to the kinapse, the zone located at the trailing edge of migrating T cells, thus demonstrating chemomechanical crosstalk between TCR and LFA-1 receptor signaling. Finally, T cells display a dampened and poorly specific response to antigen agonists when TCR forces are chemically abolished or physically "filtered" to a level below ∼12 pN using mechanically labile DNA tethers. Therefore, we conclude that T cells tune TCR mechanics with pN resolution to create a checkpoint of agonist quality necessary for specific immune response.

Keywords: T-cell receptor; antigen discrimination; cell migration; mechanotransduction; molecular tension sensor.


Conflict of interest statement

The authors declare no conflict of interest.

Figures

Fig. 1.
Fig. 1.
T cells apply pN forces to the TCR preceding the rise in Ca2+. (A) Schematic of DNA-based AuNP sensor for mapping TCR-mediated tension. The fluorescence of the Cy3B dye (pink dot) is dequenched on mechanical unfolding of the hairpin, which separates the dye from the black hole quencher 2 (BHQ2, block dot) and AuNP surface (Δx = ∼16.9 nm). (B) Plot showing the fluorescence intensity of the closed and open forms of the hairpin. There is a 103 ± 8-fold increase in fluorescence on the opening of hairpins. n = 3. Error bars indicate SD. (C) AFM image showing the immobilized AuNP sensors on a glass coverslip. (D) Simultaneous imaging of cell spreading (RICM), 19 pN TCR forces (tension), and T-cell activation (fura-2) for a representative OT-1 cell encountering α-CD3 antigen. Unless noted otherwise, all experiments were performed at 23 °C, the temperature at which F1/2 values were determined experimentally. (Scale bar: 3 μm.) (E and F) Representative plots of tension signal and fura-2 ratio showing temporal differences between the initial rise of [Ca2+] and the initial rise in TCR tension (Δtrise) and between the maximum [Ca2+] and the maximum TCR tension signal (Δtmax), and for the cell shown in D. The normalized y-axis applies to E and F. (G and H) Histogram analysis of Δtrise and Δtmax (n = 20 cells).
Fig. 2.
Fig. 2.
Magnitude and spatial organization of TCR-antigen forces are highly dependent on antigen and adhesion receptor binding. (A) Representative bright-field, RICM, and tension (12 pN and 19 pN) images of OT-1 cells cultured on tension probe surfaces modified with N4 pMHC. (B) Representative RICM and tension (12 pN) images taken from a time-lapse movie for an OT-1 cell on N4 ligand stimulation (Movie S3). (C) Representative immunostaining images showing colocalization between TCR and 12 pN tension (Upper) and colocalization among active Lck (pY 394), CD8, and 12 pN TCR tension (Lower) at t = 5 min. (D) Representative RICM and 19 pN TCR tension images taken from a time-lapse movie for an OT-1 cell on N4 and ICAM-1 stimulation (Movie S4). (E) Bar graph showing the TCR tension intensity on ligand stimulation with N4, α-CD3, and ICAM-1. n = 20 cells. Error bars represent SD. **P < 0.01; ***P < 0.001; ****P < 0.0001.
Fig. 3.
Fig. 3.
TCR forces enhance antigen specificity. (A) Representative images showing TCR tension and pYZap70 on N4 stimulation with or without ML141 treatment for 30 min. (B and C) Bar graphs quantifying TCR tension signals (B) and pYZap70 staining levels (C) for single OT-1 cells on ligand stimulation with α-CD3, N4, Q4, and V4 antigens. n = 20 cells for each group. Error bars represent SD. (D) Plot showing the correlation between TCR tension signal and pYZap70 levels for different ligands. (E) Schematic showing TGTs for modulating TCR forces and T-cell activation. TGTs in an unzipping mode (12 pN) or in a shearing mode of TGT (56 pN) were immobilized onto the 9-nm AuNP through an Au–thiol interaction. Different ligands were conjugated to the TGTs through biotin-streptavidin binding. (F) Representative images showing differential T-cell activation on N4 pMHC-modified 12 pN TGT compared with the 56 pN TGT. (G) Bar graph showing pYZap70 levels on stimulation with pMHCs anchored through the 12 or 56 pN TGT at 37 °C. n = 20 cells for each group. Error bars represent SD. ***P < 0.001; ****P < 0.0001. (H) Plot of pYZap70 levels in response to ligands with increasing potency. The slope (m) indicates the T-cell specificity to different ligands. n = 20 cells from triplicate measurements. Error bars represent SEM.
Fig. 4.
Fig. 4.
Proposed model for T-cell force generation and antigen discrimination. (A) Initial ligand-receptor engagement occurs when a T cell physically encounters an antigen-presenting cell. If strong pMHC agonists are encountered, the TCR is triggered and the initial signal is amplified, leading to cell adhesion, spreading, and force enhancement. (B) Speculative model depicting how T cells harness a chemomechanical feedback mechanism to increase the specificity of TCR signaling and distinguish between strong and weak agonists. The chemical triggering of TCR activates cytoskeletal processes that further enhance mechanical testing of the TCR–pMHC bond. (C) Data showing that TCR-pMHC complexes experience tension >12 pN during initial ligand-receptor sampling and engagement. Moreover, TCR-pMHC forces >12 pN lead to greater levels of downstream signaling for strong agonists compared with the levels achieved through weaker agonists. The mechanism of differential response to force is likely through catch bond behavior, as shown by Liu et al. (5).

References

    1. Smith-Garvin JE, Koretzky GA, Jordan MS. T cell activation. Annu Rev Immunol. 2009;27:591–619. - PMC - PubMed
    1. Chakraborty AK, Weiss A. Insights into the initiation of TCR signaling. Nat Immunol. 2014;15(9):798–807. - PMC - PubMed
    1. Kim ST, et al. The alphabeta T cell receptor is an anisotropic mechanosensor. J Biol Chem. 2009;284(45):31028–31037. - PMC - PubMed
    1. Das DK, et al. Force-dependent transition in the T-cell receptor β-subunit allosterically regulates peptide discrimination and pMHC bond lifetime. Proc Natl Acad Sci USA. 2015;112(5):1517–1522. - PMC - PubMed
    1. Liu B, Chen W, Evavold BD, Zhu C. Accumulation of dynamic catch bonds between TCR and agonist peptide MHC triggers T cell signaling. Cell. 2014;157(2):357–368. - PMC - PubMed

Publication types

MeSH terms