. 2016 May 17;113(20):E2822-31.
doi: 10.1073/pnas.1523295113. Epub 2016 May 2.

Riches of phenotype computationally extracted from microbial colonies

Affiliations

Riches of phenotype computationally extracted from microbial colonies

Tzu-Yu Liu et al. Proc Natl Acad Sci U S A. .

Abstract

The genetic, epigenetic, and physiological differences among cells in clonal microbial colonies are underexplored opportunities for discovery. A recently developed genetic assay reveals that transient losses of heterochromatic repression, a heritable form of gene silencing, occur throughout the growth of Saccharomyces colonies. This assay requires analyzing two-color fluorescence patterns in yeast colonies, which is qualitatively appealing but quantitatively challenging. In this paper, we developed a suite of automated image processing, visualization, and classification algorithms (MORPHE) that facilitated the analysis of heterochromatin dynamics in the context of colonial growth and that can be broadly adapted to many colony-based assays in Saccharomyces and other microbes. Using the features that were automatically extracted from fluorescence images, our classification method distinguished loss-of-silencing patterns between mutants and wild type with unprecedented precision. Application of MORPHE revealed subtle but significant differences in the stability of heterochromatic repression between various environmental conditions, revealed that haploid cells experienced higher rates of silencing loss than diploids, and uncovered the unexpected contribution of a sirtuin to heterochromatin dynamics.

Keywords: epigenetics; feature extraction; heterochromatin dynamics; image segmentation.


Conflict of interest statement

The authors declare no conflict of interest.

Figures
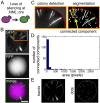
Fig. 1.
Fig. 1.
Design of the CRASH assay and detection of switching events by MORPHE. (A) The CRASH assay captures transient losses of silencing at HML::cre through a permanent, red-to-green switch in fluorescence. (B) Fluorescence of a colony of haploid cells containing HML::cre and the fluorescent reporter construct. (Scale bar, 2 mm.) (C) Close-up of colony shown in B (orange box) following colony detection (Left) and segmentation (Right). For each contour of a connected component (i.e., the boundary of the connected component, found by edge detection and dilation), we compared the pixel intensities of the interior versus the pixel intensities on the contour. If the interior pixels had higher intensities, the area enclosed by the contour was labeled as a bright region, shown in green. Once each contour was traced, we found the connected components within the colony and computed the area of each connected component. (D) Most of the detected connected components had an area of less than 500 pixels. (E) Band and dot features, both of which originated from loss-of-silencing events, were classified by thresholding the area of each connected component.
Fig. 2.
Fig. 2.
Features extracted from the fluorescence pattern of a colony. (A) The origin of the colony is shown as a red dot. The vertex of each detected connected component is represented by a green circle. Each vertex records a point in time when a loss-of-silencing event occurred. (B) The onset frequency was defined as the number of switching events divided by the area in the white ring at each given radius. The difference between the outer radius and inner radius is denoted as Δr (pixels). Because the switch to GFP expression is irreversible, we excluded the area of GFP-expressing regions from the calculation. (C) The smoothed onset frequencies were obtained by applying a sliding window across the onset-frequency spike trains and taking the average within the window. The window size was fixed to 50 pixels in this example. We also computed the area of GFP fluorescence in the white ring at each radius.
Fig. 3.
Fig. 3.
Feature extraction of haploid colonies. (A) GFP fluorescence of representative colonies for haploid strains containing individual deletions of sirtuin genes. (Scale bar, 2 mm.) (B) Smoothed onset frequencies of switching events for each genotype. The horizontal axis represents the distance from the origin in pixels, and each row represents a colony. The color bar indicates the natural logarithm of smoothed onset frequencies. (C) The area of GFP fluorescence. The color bar indicates the natural logarithm of the area of GFP fluorescence. (D) Boxplot of mean onset frequencies. Hereinafter, the red line represents the median, the whiskers extend to the most extreme values that lie within 1.5 times the interquartile range (box edges), and plus signs represent outliers.
Fig. 4.
Fig. 4.
Feature extraction of diploid colonies. (A) GFP fluorescence of representative colonies for diploid strains hemizygous for individual SIR genes. (Scale bar, 2 mm.) (B) The smoothed onset frequencies of switching events for each genotype. The horizontal axis represents the distance from the origin in pixels, and each row represents a colony. The color bar indicates the natural logarithm of smoothed onset frequencies. (C) The area of GFP fluorescence. The color bar indicates the natural logarithm of the area of GFP fluorescence. (D) Boxplot of mean onset frequencies.
Fig. 5.
Fig. 5.
Feature extraction of colonies containing various copy numbers of HML::cre and the RFP-GFP cassette. (A) GFP fluorescence of representative colonies for strains containing the specified number of chromosome sets (1n denotes haploidy and 2n denotes diploidy), HML::cre alleles, and RFP-GFP cassettes. (Scale bar, 2 mm.) (B) The smoothed onset frequencies of switching events for each genotype. The horizontal axis represents the distance from the origin in pixels, and each row represents a colony. The color bar indicates the natural logarithm of smoothed onset frequencies. (C) The area of GFP fluorescence. The color bar indicates the natural logarithm of the area of GFP fluorescence. (D) Boxplot of mean onset frequencies.
Fig. 6.
Fig. 6.
Classification of genotypes based on the extracted features. (A) Confusion matrix by random forest on the multiclass classification of wild type and mutants, including both the haploid and diploid strains. Each row of the confusion matrix represents a different genotype (actual class), and the values within a row show the proportion of colonies that were predicted by the classifier to belong to the genotype specified by each column (predicted class). The color intensity, ranging from 0 to 1, corresponds to the fraction of colonies that were assigned to a particular predicted class. Successful classification results in high values along the diagonal, where each actual genotype intersects with its corresponding predicted genotype. (B) Confusion matrices by random forest on the binary classification of wild type versus each mutant. The color intensity, ranging from 0 to 1, corresponds to the fraction of colonies that were assigned to a particular predicted class.
Fig. 7.
Fig. 7.
Feature extraction and classification of colonies grown under various levels of vitamin C. (A) GFP fluorescence of representative colonies for haploid strains grown in the presence of vitamin C. (Scale bar, 2 mm.) (B) The smoothed onset frequencies of switching, derived by applying a sliding window average. The color bar indicates the natural logarithm of smoothed onset frequencies. (C) The area of GFP fluorescence. The color bar indicates the natural logarithm of the area of GFP fluorescence. (D) Boxplot of mean onset frequencies. (E) Confusion matrix by random forest on classification of colonies grown with different levels of vitamin C. The lower concentrations of vitamin C tested (0.1 mM and 1 mM) were grouped together with the colonies grown without vitamin C. The color intensity, ranging from 0 to 1, corresponds to the fraction of colonies that were assigned to a particular predicted class.
Fig. 8.
Fig. 8.
Feature extraction and classification of colonies grown under various levels of NiCl2. (A) GFP fluorescence of representative colonies for haploid strains grown in the presence of NiCl2. (Scale bar, 2 mm.) (B) The smoothed onset frequencies of switching, derived by applying a sliding window average. The color bar indicates the natural logarithm of smoothed onset frequencies. (C) The area of GFP fluorescence. The color bar indicates the natural logarithm of the area of GFP fluorescence. (D) Boxplot of mean onset frequencies. (E) Confusion matrix by random forest on classification of colonies grown with the specified doses of NiCl2. The color intensity, ranging from 0 to 1, corresponds to the fraction of colonies that were assigned to a particular predicted class.
Fig. 9.
Fig. 9.
Feature extraction and classification of colonies grown under various levels of H2O2. (A) GFP fluorescence of representative colonies for haploid strains grown in the presence of H2O2. (Scale bar, 2 mm.) (B) The smoothed onset frequencies of switching events, derived by applying a sliding window average. The color bar indicates the natural logarithm of smoothed onset frequencies. (C) The area of GFP fluorescence. The color bar indicates the natural logarithm of the area of GFP fluorescence. (D) Boxplot of mean onset frequencies. (E) Confusion matrix by random forest on classification of colonies grown with the specified doses of H2O2. The lowest concentration of H2O2 tested (0.1 mM) was grouped together with the colonies grown without H2O2. The color intensity, ranging from 0 to 1, corresponds to the fraction of colonies that were assigned to a particular predicted class.
Fig. 10.
Fig. 10.
Feature extraction and classification of colonies grown with different sugars. (A) GFP fluorescence of representative colonies for haploid strains grown in the presence of the indicated carbon sources. (Scale bar, 2 mm.) (B) The smoothed onset frequencies of switching events, derived by applying a sliding window average. The color bar indicates the natural logarithm of smoothed onset frequencies. (C) The area of GFP fluorescence. The color bar indicates the natural logarithm of the area of GFP fluorescence. (D) Boxplot of mean onset frequencies. (E) Confusion matrices by random forest on classification of colonies grown with the specified sugar supply. The color intensity, ranging from 0 to 1, corresponds to the fraction of colonies that were assigned to a particular predicted class.

References

    1. Meunier JR, Choder M. Saccharomyces cerevisiae colony growth and ageing: Biphasic growth accompanied by changes in gene expression. Yeast. 1999;15(12):1159–1169. - PubMed
    1. Váchová L, Kucerová H, Devaux F, Ulehlová M, Palková Z. Metabolic diversification of cells during the development of yeast colonies. Environ Microbiol. 2009;11(2):494–504. - PubMed
    1. Shapiro JA. The use of Mudlac transposons as tools for vital staining to visualize clonal and non-clonal patterns of organization in bacterial growth on agar surfaces. J Gen Microbiol. 1984;130(5):1169–1181. - PubMed
    1. Gottlieb S, Esposito RE. A new role for a yeast transcriptional silencer gene, SIR2, in regulation of recombination in ribosomal DNA. Cell. 1989;56(5):771–776. - PubMed
    1. Grunstein M, Gasser SM. Epigenetics in Saccharomyces cerevisiae. Cold Spring Harb Perspect Biol. 2013;5(7):1–28. - PMC - PubMed

Publication types

MeSH terms

Substances

LinkOut - more resources