. 2015 Aug 31;5(3):e1085146.
doi: 10.1080/2162402X.2015.1085146. eCollection 2016 Mar.

PD-1 expression on dendritic cells suppresses CD8+ T cell function and antitumor immunity

Affiliations

PD-1 expression on dendritic cells suppresses CD8+ T cell function and antitumor immunity

Tong Seng Lim et al. Oncoimmunology. .

Abstract

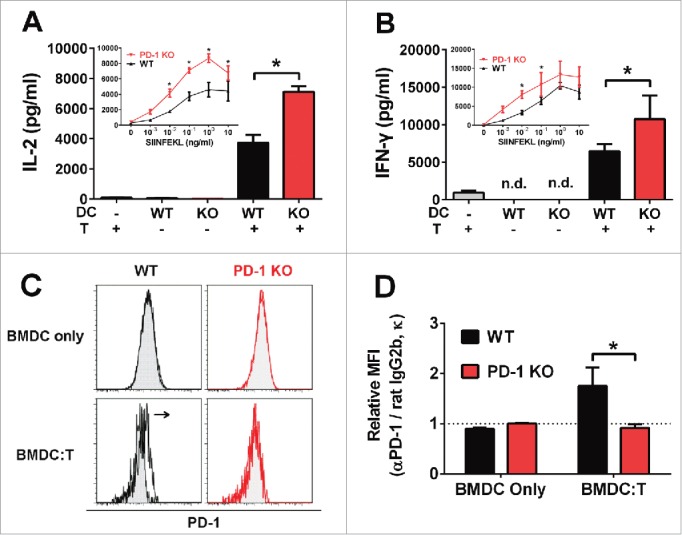
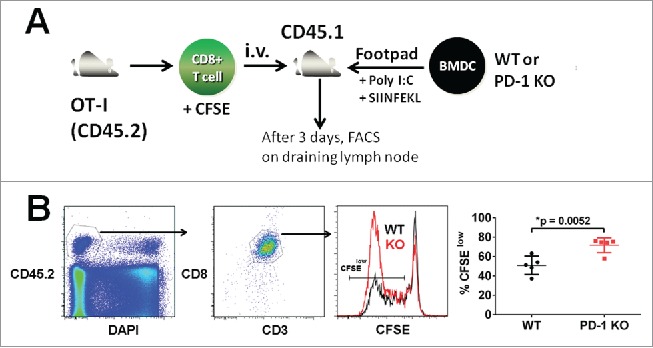
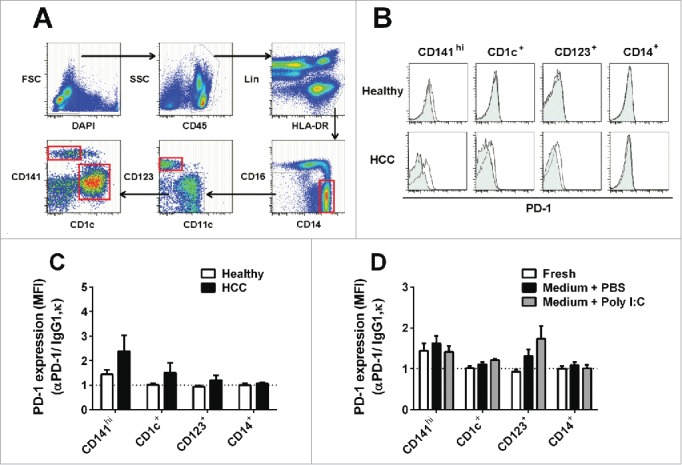
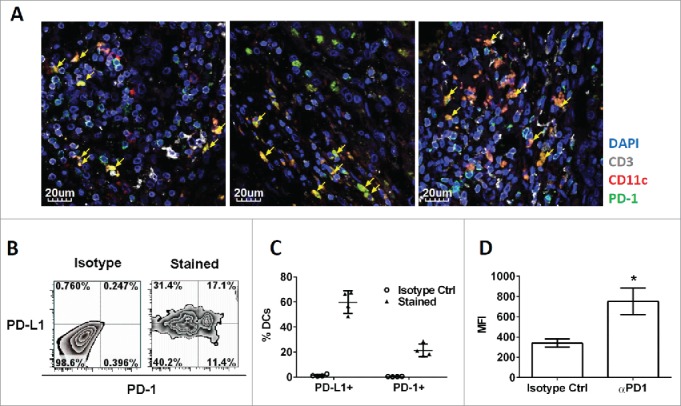
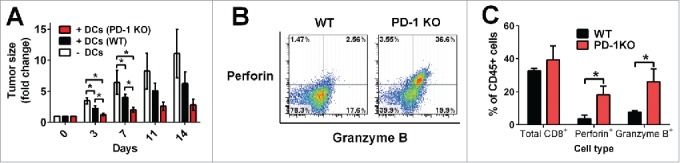
Programmed death one (PD-1) is a well-established co-inhibitory regulator that suppresses proliferation and cytokine production of T cells. Despite remarkable progress in delineating the functional roles of PD-1 on T lymphocytes, little is known about the regulatory role of PD-1 expressed on myeloid cells such as dendritic cells (DCs). Here, we show that CD8+ T cells can be more potently activated to secrete IL-2 and IFNγ by PD-1-deficient DCs compared to wild-type DCs. Adoptive transfer of PD-1-deficient DCs demonstrated their superior capabilities in inducing antigen-specific CD8+ T cell proliferation in vivo. In addition, we provide first evidence demonstrating the existence of peripheral blood DCs and CD11c+ tumor-infiltrating myeloid cells that co-express PD-1 in patients with hepatocellular carcinoma (HCC). The existence of PD-1-expressing HCC-infiltrating DCs (HIDCs) was further supported in a mouse model of HCC. Intratumoral transfer of PD-1-deficient DCs rendered recipient mice resistant to the growth of HCC by promoting tumor-infiltrating CD8+ effector T cells to secrete perforin and granzyme B. This novel finding provides a deeper understanding of the role of PD-1 in immune regulation and has significant implications for cancer immunotherapies targeting PD-1.

Keywords: Antitumor immunity; Programmed death one (PD-1); cancer immunotherapy; dendritic cell; hepatocellular carcinoma; liver cancer.


Figures

Figure 1.
Figure 1.
PD-1 expression on BMDCs inhibits IL-2 and IFNγ secretion by T cells. Cytokine secretion of (A) IL-2 and (B) IFNγ after a 2 d co-culture of CD8+ OT-I T cells with or without WT (black) or PD-1 KO (red) BMDCs pre-pulsed with 0.1 μg/mL OVA peptide (SIINFEKL). Inset figures show cytokine secretion from CD8+ OT-I T cells co-cultured with WT (black) or PD-1 KO (red) BMDCs pre-pulsed with different concentrations of OVA peptide (0–1 μg/mL) in the presence (solid line) of Poly I:C (1 μg/mL). BMDC:T co-culture ratio is 1:1. *p < 0.05, unpaired t-test. Bars indicate mean ± SD. N = 3. (C–D) PD-1 expression of WT (black) or PD-1 KO (red) BMDCs after a 2 d co-culture with (BMDC:T) or without (BMDC only) CD8+ OT-I T cells in the presence of 0.1 μg/mL OVA peptide (SIINFEKL) and 10 μg/mL Poly I:C. BMDCs were gated on DAPI-, CD3ε-, and TCR-Vα2- CD11c+, MHC-II+ cell populations. Open histogram: rat anti-mouse PD-1 antibody; Filled histogram: isotype control rat IgG 2b, κ. Quantification of PD-1 expression was determined from mean fluorescent intensity (MFI) fold change with respect to isotype control rat IgG 2b, κ. *p = 0.018, unpaired t-test. Bars indicate mean ± SD (N = 3, data was pooled from three independent experiments).
Figure 2.
Figure 2.
PD-1 deficient DCs augment antigen-specific T cell proliferation. (A) Enhanced antigen-specific T cell proliferation induced by PD-1-deficient DCs. BMDCs (WT or PD-1 KO) were pre-pulsed with or without 1 μg OVA peptide (SIINFEKL) in medium containing 10 μg/mL Poly I:C for 4 h and washed twice with PBS before injecting them in the presence of 50 μg Poly I:C into the footpads of WT CD45.1 recipient mice. CD8+ OT-I T cells (CD45.2 background) were labeled with CFSE and adoptively transferred by intravenous injection into recipient mice. (B) Three days post transfer, proliferation of antigen-specific OT-I T cells in draining popliteal lymph nodes was calculated by analyzing the dilution of CFSE by flow cytometry. OT-I T cells were gated on CD45.2+, DAPI-, CD3ε+, and CD8α+ cell populations derived from draining popliteal lymph nodes in individual recipient mice. Quantification of proliferation of antigen-specific OT-I T cells was determined from the percentage of CFSElow OT-I T cells. *p = 0.0052, unpaired t-test, N = 5, data was pooled from two independent experiments.
Figure 3.
Figure 3.
PD-1 expression on human DC subsets in peripheral blood. (A) Gating strategy for flow cytometric sorting of human blood DC subsets. Freshly isolated singlet PBMC were gated on DAPI- and CD45+ to identify live immune cells. Immune cells, including T, B, and NK populations, were stained with a panel of lineage markers (Lin: CD3, CD7, CD19, CD20, and CD56) and excluded from further analysis. Dendritic cell subsets and monocytes were identified within the MHC-II+ (HLA-DR) Lin- population. Monocytes were identified as CD14+/CD16- and CD14low/CD16+ populations. CD123 was used to identify plasmacytoid DC (pDC). Myeloid DCs (mDCs) were characterized as CD141hi or CD1c+ populations. Red boxes: DC subsets and CD14+/CD16- monocytes were sorted and cultured in medium (B) PD-1 expression on freshly isolated human blood DC subsets and CD14+/CD16- monocytes. Open histogram: mouse anti-human PD-1 antibody; Filled histogram: mouse IgG1, κ. Representative histogram from five different donors (C) PD-1 expression (MFI fold change with respect to isotype control) on each DC subset and CD14+/CD16- monocytes in human peripheral blood samples of healthy or hepatocellular carcinoma (HCC) patients. DC subsets were identified based on the gating strategy shown in Fig. 3A. Bar charts show data (mean ± SD) pooled from five individual donors. (D) PD-1 expression (MFI fold change with respect to isotype control) on each DC subset in human blood samples following culture in the presence of 10 μg/mL Poly I:C or PBS for 18 h. Bar charts show data (mean ± SD) from five healthy donors.
Figure 4.
Figure 4.
Existence of tumor-infiltrating PD-1+ CD11c+ myeloid cells in cancerous liver tissue of patient and mice. (A) Immunofluorescence (IF) images showing co-localization of PD-1 (green) with either CD11c (red) or CD3 (white). Cell nuclei were stained with DAPI (blue). CD11c+ myeloid cells expressing PD-1 were identified in yellow color (arrow head). Each IF image was captured from cancerous liver tissue from individual HCC patients (N = 3). (B) HIDCs co-express PD-1 and PD-L1 in the spontaneous HCC mouse model. Quadrants were established with reference to the isotype controls. The inset values are the percentage of HIDCs within each quadrant. All HIDCs were gated on GR1-, CD3-, F4/80-, CD11chi, MHC-II+ cells. (C) Percentages of HIDCs which co-express PD-1 or PD-L1. Each data point was derived from individual HCC mice (N = 4). (D) Quantification of PD-1 expression on HIDCs by flow cytometry. Mean fluorescent intensity (MFI) values were determined from individual HCC mice (N = 4). HCC: hepatocellular carcinoma; HIDC: HCC-infiltrating DC. *p < 0.02, unpaired t-test.
Figure 5.
Figure 5.
Enhanced antitumor effect on primary established HCC by intratumoral transfer of PD-1 KO DCs. (A) Hepa1-6 cells were transplanted subcutaneously into the flanks of WT recipient mice. Intratumoral injection with WT (black), PD-1 KO (red) BMDCs or PBS only (white) were performed 1 week later. Day 0 is defined as the day of DC injection. Sizes of transplanted HCC tumors were measured for 14 d post DC transfer, and the data were normalized to the tumor sizes at day 0. *p < 0.05, unpaired t-test, N = 7, data was pooled from two independent experiments. (B) Increased perforin- and granzyme B-secreting tumor-infiltrating CD8+ T cells in primary established HCC after transfer of PD-1 KO BMDCs. Mice with established subcutaneous Hepa1-6 tumors were sacrificed on day 7 after intratumoral transfer of WT and PD-1 KO BMDCs. Perforin- and granzyme B-secreting CD8+ T cells were evaluated by intracellular staining followed by flow cytometry. All cells were gated on the CD45+, CD3ε+, and CD8+ population. Quadrants were established with reference to the isotype controls. A representative density plot from one mouse is shown. (C) Percentages of perforin- and granzyme B-expressing CD8+ T cells and total tumor-infiltrating CD8+ T cells 7 d post intratumoral transfer of WT and PD-1 KO BMDCs. Cell percentages are relative to total CD45+ live singlet T cells; *p < 0.05, unpaired t-test, N ≥ 3 per group.

References

    1. Keir ME, Butte MJ, Freeman GJ, Sharpe AH. PD-1 and its ligands in tolerance and immunity. Annu Rev Immunol 2008; 26:677-704; PMID:18173375; http://dx.doi.org/10.1146/annurev.immunol.26.021607.090331. - DOI - PMC - PubMed
    1. Ishida Y, Agata Y, Shibahara K, Honjo T. Induced expression of PD-1, a novel member of the immunoglobulin gene superfamily, upon programmed cell death. EMBO J 1992; 11:3887-95; PMID:1396582. - PMC - PubMed
    1. Nishimura H, Nose M, Hiai H, Minato N, Honjo T. Development of lupus-like autoimmune diseases by disruption of the PD-1 gene encoding an ITIM motif-carrying immunoreceptor. Immunity 1999; 11:141-51; PMID:10485649; http://dx.doi.org/10.1016/S1074-7613(00)80089-8. - DOI - PubMed
    1. Nishimura H, Okazaki T, Tanaka Y, Nakatani K, Hara M, Matsumori A, Sasayama S, Mizoguchi A, Hiai H, Minato N, et al. Autoimmune dilated cardiomyopathy in PD-1 receptor-deficient mice. Science 2001; 291:319-22; PMID:11209085; http://dx.doi.org/10.1126/science.291.5502.319. - DOI - PubMed
    1. Wang J, Yoshida T, Nakaki F, Hiai H, Okazaki T, Honjo T. Establishment of NOD-Pdcd1-/- mice as an efficient animal model of type I diabetes. Proc Natl Acad Sci U S A 2005; 102:11823-8; PMID:16087865; http://dx.doi.org/10.1073/pnas.0505497102. - DOI - PMC - PubMed

Publication types