. 2015 Oct 29;5(3):e1091146.
doi: 10.1080/2162402X.2015.1091146. eCollection 2016 Mar.

A novel regulation of PD-1 ligands on mesenchymal stromal cells through MMP-mediated proteolytic cleavage

Affiliations

A novel regulation of PD-1 ligands on mesenchymal stromal cells through MMP-mediated proteolytic cleavage

Colette Dezutter-Dambuyant et al. Oncoimmunology. .

Abstract

Whether fibroblasts regulate immune response is a crucial issue in the modulation of inflammatory responses. Herein, we demonstrate that foreskin fibroblasts (FFs) potently inhibit CD3+ T cell proliferation through a mechanism involving early apoptosis of activated T cells. Using blocking antibodies, we demonstrate that the inhibition of T cell proliferation occurs through cell-to-cell interactions implicating PD-1 receptor expressed on T cells and its ligands, PD-L1 and PD-L2, on fibroblasts. Dual PD-1 ligand neutralization is required to abrogate (i) binding of the PD-1-Fc fusion protein, (ii) early apoptosis of T cells, and (iii) inhibition of T cell proliferation. Of utmost importance, we provide the first evidence that PD-1 ligand expression is regulated through proteolytic cleavage by endogenous matrix metalloproteinases (MMPs) without transcriptional alteration during culture-time. Using (i) different purified enzymatic activities, (ii) MMP-specific inhibitors, and (iii) recombinant human MMP-9 and MMP-13, we demonstrated that in contrast to CD80/CD86, PD-L1 was selectively cleaved by MMP-13, while PD-L2 was sensitive to broader MMP activities. Their cleavage by exogenous MMP-9 and MMP-13 with loss of PD-1 binding domain resulted in the reversion of apoptotic signals on mitogen-activated CD3+ T cells. We suggest that MMP-dependent cleavage of PD-1 ligands on fibroblasts may limit their immunosuppressive capacity and thus contribute to the exacerbation of inflammation in tissues. In contrast, carcinoma-associated fibroblasts appear PD-1 ligand-depleted through MMP activity that may impair physical deletion of exhausted defective memory T cells through apoptosis and facilitate their regulatory functions. These observations should be considered when using the powerful PD-1/PD-L1 blocking immunotherapies.

Keywords: Apoptosis; MMP-13; PD-L1; PD-L2; PD1; fibroblasts; immunosuppression.


Figures
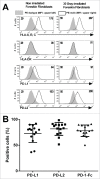
Figure 1.
Figure 1.
Infant foreskin fibroblasts express PD-L1 and PD-L2 molecules and bind PD-1-Fc fusion protein. (A) PD-L1 and PD-L2 expression on infant foreskin fibroblasts (FFs) is not modulated by a 30 Gray-irradiation after 3–5 passages. The expression of surface markers was analyzed by flow cytometry on FFs that were irradiated or not and cultured for 48 h under an identical seeding concentration. Flow histograms are representative of n = 3 independent experiments. Filled histograms showed isotype control staining and open histograms showed the specific expression of the indicated cell surface marker. Mean Fluorescence Intensity (MFI) values are indicated upper left for isotype mAb and upper right for specific markers. (B) Frequency of PD-L1 and PD-L2 expression, and of PD-1-Fc fusion protein binding on 30 Gray-irradiated infant foreskin fibroblasts. The frequency of cells expressing PD-L1, PD-L2, and binding PD-1-Fc fusion protein was analyzed by flow cytometry on γ-FFs after 24 h of culture under an identical seeding concentration. Each symbol represents a different FF donor, n = 14 independent donors are shown.
Figure 2.
Figure 2.
Binding of PD-1-Fc fusion protein on 30 Gray-irradiated infant foreskin fibroblasts is abrogated by anti-PD-1 ligand mAbs. The binding of PD-1-Fc fusion protein (PD-1-Fc) to γ-FFs was analyzed before (i and ii) and after (from iii to viii) exposure to blocking anti-PD-L1 (clone 29E2A3) and/or anti-PD-L2 mAbs (clone 24F10C12). Representative dot plots showing isotype control (i, iii, v, and vii) and PD-1-Fc binding (ii, iv, vi, and viii) on γ-FFs non pre-incubated (A) or pre-incubated with PD-L1 (B), PD-L2 (C), and both PD-L1 and PD-L2 (D) blocking mAbs. (A–D) Representative flow histogram overlay of PE-GAH-Fc control (filled histograms) and of PD-1-Fc + PE-GAH-Fc (open histograms). Mean Fluorescence Intensity (MFI) values are indicated upper left for negative control and upper right for PD-1-Fc. (E) Frequency and (F) MFI of positive cells showing binding to PD-1-Fc fusion protein. PD-1-Fc binding was neutralized by anti-PD-L1 (open circle), anti-PD-L2 alone (open square) or combined to 50 µg/mL anti-PD-L1 (closed triangle) blocking mAbs at the indicated concentrations. Closed circle on dotted lines represent isotype-matched controls (mixed IgG2a (50µg/mL)/IgG2b) and large dotted lines represent PE-conjugated goat anti-human immunoglobulin Fc portion (PE-GAH-Fc) alone. Data are representative of n = 3 independent experiments (n = 2 γ-FF donors). Bars represent the SD. **p < 0 .01 and ***p < 0 .001.
Figure 3.
Figure 3.
At low seeding density, 30 Gray-irradiated infant foreskin fibroblasts upregulate PD-1 ligand expression and their capacity to bind PD1-Fc fusion protein in presence of pro-inflammatory cytokines. γ-FFs seeded at 7 × 10³/cm2 were maintained in culture for 2 d in presence of pro-inflammatory cytokines (IFNγ, TNFα, IL-1α, IL-1β, TGFβ1, and IL-17A). Expression levels of PD-1 ligands and binding capacity of PD-1-Fc were detected by flow cytometry. (A, B) Representative flow histogram overlay showing isotype control staining (filled histograms) and specific expression of PD-L1 and PD-L2 (open histograms). Mean Fluorescence Intensity (MFI) values are indicated upper left for isotype mAb and upper right for specific markers. (C) Representative flow histogram overlay showing control staining with PE-GAH-Fc (filled histograms) with MFI value in upper left and PD-1-Fc binding (open histograms) with MFI value in upper right. Cytometry data are representative of n = 3 independent experiments.
Figure 4.
Figure 4.
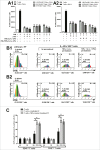
30 Gray-irradiated infant foreskin fibroblasts reduce the numbers of mitogen-activated CD3+ cells upon co-culture by inducing early apoptosis of PHA-activated T cells. The proliferative response of CFSE-labeled CD3+ T cells, co-labeled with anti-CD4+ and anti-CD8+ antibodies was analyzed by flow cytometry after 7 d of co-culture on plated γ-FFs, and activation by PHA-L (0.5µg/mL). (A1, A2) Data showed the number of CD4+ and CD8+ T cells among total CD3+ T cells (calculated on FlowJo® software) cultured for 5 d on γ-FFs at different ratios of 1.25 γ-FFs:100 T cells, 2.5 γ-FFs:100 T cells and 5 γ-FFs/100 T cells (n = 3 independent experiments). Significant value is **p < 0 .01 between “T cells+PHA-L” (black histogram) and all other conditions (multiple gray histograms). (B1, B2) Representative FlowJo® analysis of the CFSE dilution (PI: Proliferation Index), the numbers of CD4+ and CD8+ T cells, and the percentage of divided CD4+ (i–iv) and CD8+ T cells (v–viii) at a ratio of 5 γ-FFs: 100 CD3+ T cells. (C) The percentage of early apoptotic CD3+ T cells (DAPI/Annexin V+ T cells) was determined in absence or in presence of γ-FFs treated or not by TNFα at a ratio of 5 γ-FFs:100 T cells. Before co-culture with γ-FFs (0 h), after 3 h of co-culture with γ-FFs (3 h), and after 3 h of co-culture with γ-FFs and then 17 h of PHA (0.25 µg/mL) activation (3 h + 17 h PHA), T cells were co-labeled with anti-CD4 PerCP-Cy5.5-mAb and anti-CD8 APC-mAb, stained with PE-Annexin V, and then analyzed by flow cytometry. Summation data of six independent experiments are shown (n = 4 T cell donors and n = 2 γ-FF donors). Bars represent the SD. *p < 0 .05.
Figure 5.
Figure 5.
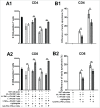
PD-L1 and PD-L2 blockade by mAbs reverts the inhibition of T cell proliferation and the induction of T cell apoptosis triggered by 30 Gray-irradiated infant foreskin fibroblasts. (A1, A2) PHA was added to a co-culture of γ-FFs pre-treated or not with TNFα and CD3+ T cells at different ratios of 2.5 γ-FFs:100 T cells and 5 γ-FFs:100 T cells. Flow cytometry analysis of the number of the total bulk CD3+ T cells, co-labeled with anti-CD4 and anti-CD8 mAbs was performed after 7 d of co-culture in the presence or not of anti-PD-L1 (clone 29E23A3)/anti-PD-L2 (clone 24F10C12 ) mAbs or isotype control antibodies (mouse IgG2a/IgG2b). Results are mean ± SD of the number of CD4+ cells and CD8+ T cells within the CD3+ T cells and are representative of three independent experiments. Bars represent the SD, **p < 0 .01. (B1, B2) The blocking capacity of mixed anti-PD-L1 (clone 29E23A3) and anti-PD-L2 mAbs (clone 24F10C12), compared to mixed isotype controls (mouse IgG2a/IgG2b) was determined by the difference of percentage of early apoptotic CD3+ T cells (DAPI/Annexin V+ T cells) in presence or in absence of γ-FFs at two ratios of 2.5 γ-FFs:100 T cells and 5 γ-FFs:100 T cells. 17 h after PHA stimulation in the conditions as indicated, T cells were co-labeled with anti-CD4-FITC mAb and anti-CD8-PerCP-Cy5.5 mAb, stained with PE-Annexin V, and then analyzed by flow cytometry. Results are representative of n = 3 independent experiments. Bars represent the SD. *p < 0 .05, **p < 0 .01.
Figure 6.
Figure 6.
PD-L1, PD-L2, and CD10 transcript quantitation by droplet digital PCR and loss of PD-L1 and PD-L2 expression, and of the capacity to bind PD-1-Fc fusion protein on 30 Gray-irradiated infant foreskin fibroblasts after 4 d and 14 d of culture. Under similar seeding cell density (13 × 103/cm2) γ-FFs (three donors) were maintained in culture for 1, 4, and 14 d (A) Purified total RNA of γ-FFs were examined. All RNAs were quantified by droplet digital PCR and all transcript concentrations are given in copy number/μL (B) Frequency of CD10+, PD-L1+, and PD-L2+ cells and frequency of positive cells showing a binding to PD-1-Fc at different times of culture were detected by flow cytometry. (C) Mean fluorescence intensity (MFI) ratio = MFI of cells after labeling with anti-CD10 PE-mAb, anti-PD-L1 PE-mAb, and with anti-PD-L2 PE-mAb: MFI of cells incubated with PE-IgG1 isotype. MFI ratio = MFI of cells after binding with PD-1-Fc fusion protein + PE-conjugated goat anti-human immunoglobulin Fc portion (PE-GAH-Fc):MFI of cells incubated with PE-GAH-Fc. Summation data of three γ-FF donors are shown and representative of n = 3 independent experiments. Bars represent the SD. *p < 0 .05, ***p < 0 .001.
Figure 7.
Figure 7.
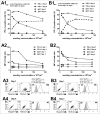
High seeding density of 30 Gray-irradiated infant foreskin fibroblasts favored the loss of PD-L1 and PD-L2 expression between day 1 and day 4 of culture. Under different seeding cell concentrations (7 × 10³; 14 × 103; 35 × 103; 70 × 103; 140 × 103/cm2), γ-FFs were maintained in culture for 1 and 4 d. Expression levels of PD-1 ligands were detected by flow cytometry. (A1, B1) Frequency of PD-L1 (A1) and PD-L2 (B1) positive cells, and isotype controls (PE-IgG1). Loss of positive cells was calculated between day 1 and day 4 at each seeding density (dotted line). (A2, B2) Mean fluorescence intensity (MFI) of positive cells after labeling with anti-PD-L1 PE-mAb (A2) and with anti-PD-L2 PE-mAb (B2). (A3, A4, B3, B4) For a seeding concentration of 35 × 103/cm2, representative dot-plots showed isotype control (i,iii) and PE-PD-L1 mAb (ii,iv) on γ-FFs on day 1 (A3) and day 4 (A4), respectively. Representative flow histogram overlay showed isotype control (filled histograms) with MFI value in upper left and PE-PD-L1 mAb (open histograms) with MFI value in upper right. Representative dot-plots showed isotype control (v,vii) and PE-PD-L2 mAb (vi,viii) on γ-FFs on day 1 (B3) and day 4 (B4), respectively. Representative flow histogram overlay showed isotype control (filled histograms) with MFI value in upper left and PE-PD-L2 mAb (open histograms) with MFI value in upper right. Cytometry data are representative of n = 2 independent experiments.
Figure 8.
Figure 8.
Cleavage/shedding of PD-L1, PD-L2, and PD-1-Fc binding by exogenous enzymes with MMP-like activities. After 1 day of culture, γ-FFs were maintained at 37°C in suspension in presence of different concentrations of chromatographically purified collagenase (CLSPA, 500 and 1000 U/mL), Dispase II® (0.5, 1, and 2 U/mL), and Thermolysin (50, 100, and 200 µg/mL) for 1 h. Expression levels of PD-1 ligands and binding capacity of PD-1-Fc were detected by flow cytometry. (A) Representative flow histogram overlay showed isotype control (filled histograms) with MFI value in upper left and PE-PD-L1 mAb/PE-PD-L2 mAb (open histograms) with MFI value in upper right. Representative flow histogram overlay showed PE-GAH-Fc control (filled histograms) with MFI value in upper left and PD-1-Fc + PE-GAH-Fc (open histograms) with MFI value in upper right. (B) Frequency of PD-L1+, PD-L2+ cells, and PD-1-Fc-binding cells after cleavage by collagenase (CLSPA), Dispase II®, and Thermolysin. Data are representative of n = 3 independent experiments. Bars represent the SD. *p < 0 .05.
Figure 9.
Figure 9.
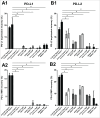
The specific MMP-13 inhibitor CL82198 significantly restored PD-L1 and PD-L2 expression on 30 Gray-irradiated infant foreskin fibroblasts maintained in culture for 4 d. After 1 day of culture at 37°C, γ-FFs were further cultured for 4 d at 37°C in presence or not of MMP inhibitors (without any medium change). Six MMP inhibitors were tested at two different concentrations. Expression levels of PD-L1 and PD-L2 were detected by flow cytometry on γ-FFs on day 1 and day 4. (A1, B1) Recovery (%) of the frequency of PD-L1+ and PD-L2+ cells after 4 d of culture in presence of the MMP inhibitors. (A2, B2) Recovery (%) of mean fluorescence intensity (MFI) value of the PD-L1+ and PD-L2+ cells cultured in presence of MMP inhibitors for 4 d. Results are representative of n = 4 independent experiments. Bars represent the SD *p < 0 .05 between CL82198 12 µg/mL (black histogram) and all other concentrations of MMP inhibitors tested (Actinonin, SB3CT, NNGH, Z-Pro-Leu-Gly-NHOH, GM6001).
Figure 10.
Figure 10.
PD-L1 and PD-L2 cleavage by exogenous MMP-9 and MMP-13 on 30 Gray-irradiated infant foreskin fibroblasts reverts apoptotic signals on mitogen-activated T cells. (A–C) After 2 d of culture in presence of 100 ng/mL TNFα, plated γ-FFs were fixed with 2% PFA then after washing were incubated at 37°C in presence of APMA-activated pro-MMP-9 and pro-MMP-13 in culture medium (1% FCS) for 24 h. Expression levels of PD-1 ligands and binding capacity of PD-1-Fc (3 µg/mL) were detected by flow cytometry. Frequency of PD-L1+, PD-L2+ cells (A, B), and PD-1-Fc-binding cells (C) was calculated after 24 h incubation in presence or not of exogenous MMP-9 and MMP-13. Results are representative of two independent experiments. Bars represent the SD. *p < 0 .05. (D–E): After 2 d of culture, γ-FFs were directly incubated at 37°C in presence or not of APMA-activated pro-MMP-9 and pro-MMP-13 in culture medium (1% FCS) for 24 h. CD3+ T cells were added and early T cell apoptosis after 17 h-PHA activation was determined by the difference of percentage of early apoptotic CD3+ T cells (DAPI T cells/Annexin V+) in presence or in absence of γ-FFs at two ratios of 2.5 γ-FFs:100 T cells and 5 γ-FFs:100 T cells. After PHA activation in the conditions as indicated, T cells were co-labeled with anti-CD4-FITC mAb and anti-CD8-PerCP-Cy5.5 mAb, stained with PE-Annexin V and, then analyzed by flow cytometry. Results are representative of n = 2 independent experiments. Bars represent the SD *p < 0 .05.
Figure 11.
Figure 11.
Comparison between 30 Gray-irradiated Carcinoma Associated Fibroblasts (γ-CAFs) and 30 Gray-irradiated infant foreskin fibroblasts (γ-FFs) in their PD-1 ligand expression, inhibitory capacity of mitogen-induced T cell proliferation, and MMP-1, MMP-9, and MMP-13 secretion capacity. (A) Frequency of PD-L1 and PD-L2 expression and of PD-1-Fc fusion protein binding on γ-FFs (n = 13 donors) and γ-CAFs (n = 8 donors). The frequency of cells expressing PD-L1, PD-L2, and PD-1-Fc binding was analyzed by flow cytometry after 24 h of culture under identical seeding concentrations. Each symbol represents a different donor. Bars represent mean values ± SD. (B) γ-CAFs do not reduce the numbers of CD3+ T cells after 7 d of co-culture in presence of the polyclonal mitogen PHA-L (0.5 µg/mL). PD-L1 and PD-L2 blockade by anti-PD-1 ligand mAbs (clone 29E23A3 + clone 24F10C12) only reverts the inhibition of T cell proliferation by γ-FFs. Data represent the numbers of CD4+ cells and CD8+ T cells within the CD3+ T cells. Bars represent SD *p < 0 .05. (C) Quantitative determination of MMP-1, MMP-9, and MMP-13 released by γ-FFs (n = 4 donors) and γ-CAFs (n = 4 donors). γ-FFs and γ-CAFs were plated for 4 h in D-MEM supplemented with 10% FCS and D-MEM/F-12:1/1 supplemented with 10% FCS, respectively at 37°C. Only γ-FFs were incubated for 2 h at 37°C in presence of 100 ng/mL TNFα in D-MEM supplemented with 1% FCS while γ-CAFs were directly incubated in D-MEM/F-12:1/1 supplemented with 1% FCS. Both γ-FFs and γ-CAFs were maintained for 5 d in their respective medium supplemented with 1% FCS (without any medium change). Supernatants (duplicate) were analyzed with Magnetic Luminex® Performance Assay test (Human MMP-1, MMP-9, and MMP-13).

Similar articles

Cited by

References

    1. Bernardo ME, Fibbe WE. Mesenchymal stromal cells: sensors and switchers of inflammation. Cell Stem Cell 2013; 13:392-402; PMID:24094322; http://dx.doi.org/10.1016/j.stem.2013.09.006 - DOI - PubMed
    1. Frenette PS, Pinho S, Lucas D, Scheiermann C. Mesenchymal stem cell: keystone of the hematopoietic stem cell niche and a stepping-stone for regenerative medicine. Annu Rev Immunol 2013; 31:285-316; PMID:23298209; http://dx.doi.org/10.1146/annurev-immunol-032712-095919 - DOI - PubMed
    1. Le BK, Mougiakakos D. Multipotent mesenchymal stromal cells and the innate immune system. Nat Rev Immunol 2012; 12:383-96; PMID:22531326; http://dx.doi.org/10.1038/nri3209 - DOI - PubMed
    1. Chang HY, Chi JT, Dudoit S, Bondre C, van de Rijn M, Botstein D, Brown PO. Diversity, topographic differentiation, and positional memory in human fibroblasts. Proc Natl Acad Sci U S A 2002; 99:12877-82; PMID:12297622; http://dx.doi.org/10.1073/pnas.162488599 - DOI - PMC - PubMed
    1. Haniffa MA, Wang XN, Holtick U, Rae M, Isaacs JD, Dickinson AM, Hilkens CM, Collin MP. Adult human fibroblasts are potent immunoregulatory cells and functionally equivalent to mesenchymal stem cells. J Immunol 2007; 179:1595-604; PMID:17641026; http://dx.doi.org/10.4049/jimmunol.179.3.1595 - DOI - PubMed

Publication types