. 2016 May 4:6:25100.
doi: 10.1038/srep25100.

Development of Persister-FACSeq: a method to massively parallelize quantification of persister physiology and its heterogeneity

Affiliations

Development of Persister-FACSeq: a method to massively parallelize quantification of persister physiology and its heterogeneity

Theresa C Henry et al. Sci Rep. .

Abstract

Bacterial persisters are thought to underlie the relapse of chronic infections. Knowledge of persister physiology would illuminate avenues for therapeutic intervention; however, such knowledge has remained elusive because persisters have yet to be segregated from other cell types to sufficient purity. This technical hurdle has stymied progress toward understanding persistence. Here we developed Persister-FACSeq, which is a method that uses fluorescence-activated cell sorting, antibiotic tolerance assays, and next generation sequencing to interrogate persister physiology and its heterogeneity. As a proof-of-concept, we used Persister-FACSeq on a library of reporters to study gene expression distributions in non-growing Escherichia coli, and found that persistence to ofloxacin is inversely correlated with the capacity of non-growing cells to synthesize protein. Since Persister-FACSeq can be applied to study persistence to any antibiotic in any environment for any bacteria that can harbor a fluorescent reporter, we anticipate that it will yield unprecedented knowledge of this detrimental phenotype.


Figures

Figure 1
Figure 1. Standard FACS method to measure persister gene expression and parallelized method developed here (Persister-FACSeq).
(a) Current FACS approach to measure persister gene expression from a single promoter reporter. (b) Flow diagram of Persister-FACSeq: a parallelization of approach in (a) to measure persister gene expression simultaneously from a library of promoter reporters using FACS and HT sequencing.
Figure 2
Figure 2. Positive control system.
(a) Strains OFLRΔlacIΔlacZ + PlacZ-gfp and lacIqΔlacZ + PlacZ-gfp have survival fractions (persister frequencies) of 0.46 ± 0.05 and 0.05 ± 0.02, respectively, after 5 h treatment with OFL (5 μg/mL) in stationary phase. Data are averages of 3 biological replicates; error bars portray standard error of the mean (s.e.m.). (b) Histograms of strains OFLRΔlacIΔlacZ + PlacZ-gfp and lacIqΔlacZ + PlacZ-gfp. Histograms are representative of 3 biological replicates. (c) Histogram of a 90% lacIqΔlacZ + PlacZ-gfp and 10% OFLRΔlacIΔlacZ + PlacZ-gfp mixture. A-B-C-D designates FACS quantiles used for OFL tolerance assays shown in (d,e). Quantiles C and D both contain 25% of the population. Quantile A contains either 25% or the smallest possible fraction of the population based on the sorter’s ability to resolve low-fluorescing events, and quantile B contains 25% or the remaining fraction of the population. Histogram is representative of 3 biological replicates. (d) NPPs of FACS-sorted samples. Expected NPPs were calculated based on survival fractions (persister frequencies) of the individual strains after 5 h OFL (5 μg/mL) treatment (a) and the knowledge that OFLRΔlacIΔlacZ + PlacZ-gfp falls in quantile D. An approximate 4-fold increase in survival in the HFQ (quantile D) as compared to the LFQs (quantiles A, B, C) was expected. When 2 million cells were sorted from the total population using FACS, a statistically-significant ~4-fold increase in survival was seen in the HFQ as compared to the LFQs (t-test, p-value ≤ 0.05), confirming the expected results. Results are averages of 3 biological replicates; error bars portray s.e.m. (e) Positive control system has high NPP in HFQ (quantile D) as compared to LFQs (quantiles A, B, C). Two million and 200,000 were sorted from a 90/10 lacIq/OFLR mixture. 800,000 and 80,000 were sorted from a 90/10 lacIq/OFLR2 mixture. Data are averages of 3 biological replicates; error bars portray s.e.m.
Figure 3
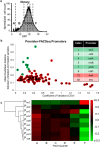
Figure 3. Persister-FACSeq identifies promoters with distinct normal cell and persister gene expression patterns.
(a) Fluorescence distribution of promoter reporter library [representative of n = 6 (two FACS experiments per Persister-FACSeq replicate, which was performed in triplicate for this study)]. FACS quantiles are designated by A-B-C-D-E-F. Fractions of the entire population sorted into each quantile were in general 0.25, 0.15, 0.15, 0.15, 0.15, 0.15 for A-B-C-D-E-F, respectively. (b) Plot of mean Euclidean distance between untreated and treated samples against coefficient of variation (COV) for each promoter (n = 3). Green markers represent promoters with Euclidean distances that are significantly different from Euclidean distances of randomized reads of the same promoter as determined using t-tests and a p-value ≤ 0.05 (Methods) (Supplementary Table S4), which indicates distinct normal cell and persister gene expression patterns. Red markers represent promoters with Euclidean distances not significantly different from Euclidean distances of randomized reads of the same promoter (t-test, p-value > 0.05). Inset lists promoters subjected to monoculture verification. (c) Hierarchical clustering of differences between persister proportions and normal cell proportions (Ppropand Nprop, colorbar represents the magnitudes of the differences) for promoters identified to have distinct normal cell and persister gene expression patterns. Replicates consist of ≥ 3 independent experiments.
Figure 4
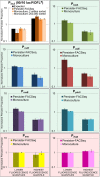
Figure 4. Monoculture NPPs confirm Persister-FACSeq NPPs for positive control system and all promoters tested.
White background indicates positive control system; green background indicates promoters predicted to have distinct normal cell and persister gene expression patterns; red background indicates promoters predicted to not have distinct normal cell and persister gene expression patterns. FACS quantile gating strategies for PlacZ and Persister-FACSeq are described in Figs 2 and 3, respectively. FACS quantile gating strategies for monoculture PbolA, PcsiD, PcsiE, PrssB, PydcS, Peno, and PfrdA are described in Supplementary Fig. S5b. Data are averages of 3 biological replicates; error bars portray s.e.m. NPPs of each quantile from Persister-FACSeq data are shown in Supplementary Fig. S5a. Controls are shown in Supplementary Fig. S6a.
Figure 5
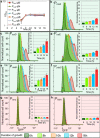
Figure 5. Promoters with distinct normal cell and persister gene expression patterns have a subpopulation that continues to synthesize protein in stationary phase.
(a) Growth curves of reporter strains show that reporter strains reach stationary phase by ~8 h. Data are averages of 3 biological replicates; error bars portray s.e.m. (bf) Promoters with distinct normal cell and persister gene expression patterns contain a subpopulation which continues to actively synthesize protein in stationary phase, as demonstrated by increasing fluorescence between hours 8–16. (g,h) Promoters not demonstrating distinct normal cell and persister gene expression patterns exhibit constant low fluorescence throughout stationary phase. Histograms are representative of 3 biological replicates. Bar graph insets show fluorescence values normalized to t = 6 h. Graphs represent 3 biological replicates, error bars portray s.e.m.
Figure 6
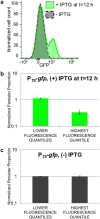
Figure 6. Active protein production in stationary phase correlates with low tolerance to ofloxacin.
(a) Fluorescence distribution of MG1655 bearing PT5-gfp at t = 16 h (+)/(−) IPTG induction at t = 12 h; representative of 3 biological replicates. (b) FACS and OFL tolerance assays were performed on the IPTG-induced PT5-gfp population (green histogram in (a)). FACS quantiles were set so that quantile D contained 10% of the entire population, quantile A contained the least number of events possible based on the resolution capabilities of the sorter, quantile C contained <3% of the fluorescent-negative sample (uninduced PT5-gfp), and quantile B contained the remainder of the population. LFQs demonstrate a statistically-significant ~3-fold higher NPP than that of the HFQ (t-test, p-value ≤ 0.05). Data are averages of 3 biological replicates; error bars portray s.e.m. (c) FACS and OFL tolerance assays were performed on an uninduced PT5-gfp population (gray histogram in (a)) using the gating strategy described in (b) except that quantiles B and C contained equal amounts of the population. LFQs and HFQ demonstrate equivalent persistence levels (t-test, p-value > 0.05). Data are averages of 3 biological replicates; error bars portray s.e.m.

Similar articles

Cited by

References

    1. Klevens R. M. et al. Estimating health care-associated infections and deaths in US hospitals, 2002. Public Health Rep. 122, 160–166 (2007). - PMC - PubMed
    1. Stone P. W. Economic burden of healthcare-associated infections: an American perspective. Expert Rev. Pharmacoecon. Outcomes Res. 9, 417–422 (2009). - PMC - PubMed
    1. Lewis K. Persister cells. Annu. Rev. Microbiol. 64, 357–372 (2010). - PubMed
    1. Allison K. R., Brynildsen M. P. & Collins J. J. Heterogeneous bacterial persisters and engineering approaches to eliminate them. Curr. Opin. Microbiol. 14, 593–598 (2011). - PMC - PubMed
    1. Fauvart M., De Groote V. N. & Michiels J. Role of persister cells in chronic infections: clinical relevance and perspectives on anti-persister therapies. J. Med. Microbiol. 60, 699–709 (2011). - PubMed

Publication types

MeSH terms