

Selecting SNPs informative for African, American Indian and European Ancestry: application to the Family Investigation of Nephropathy and Diabetes (FIND)
- PMID: 27142425
- PMCID: PMC4855449
- DOI: 10.1186/s12864-016-2654-x
Selecting SNPs informative for African, American Indian and European Ancestry: application to the Family Investigation of Nephropathy and Diabetes (FIND)
Abstract
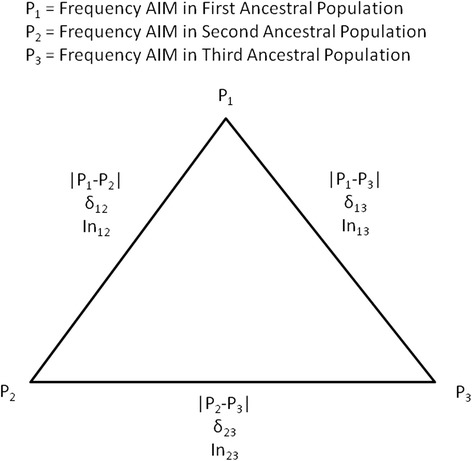
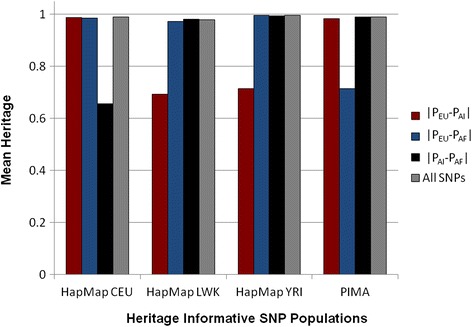
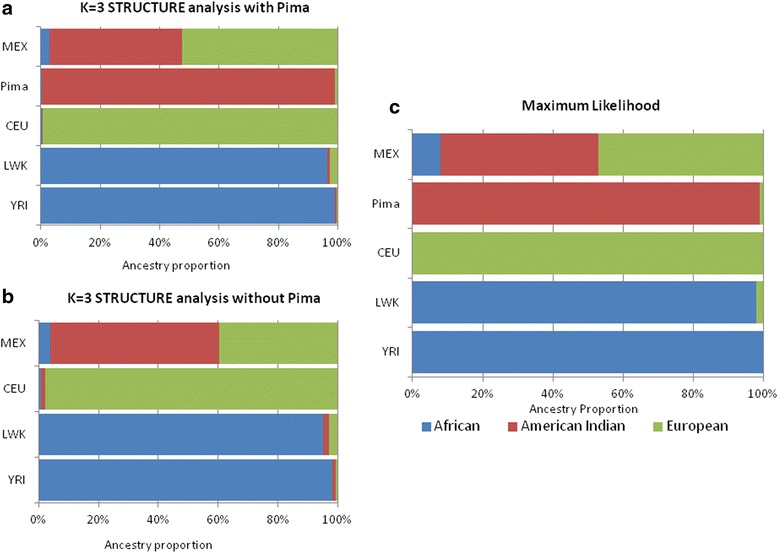
Background: The presence of population structure in a sample may confound the search for important genetic loci associated with disease. Our four samples in the Family Investigation of Nephropathy and Diabetes (FIND), European Americans, Mexican Americans, African Americans, and American Indians are part of a genome- wide association study in which population structure might be particularly important. We therefore decided to study in detail one component of this, individual genetic ancestry (IGA). From SNPs present on the Affymetrix 6.0 Human SNP array, we identified 3 sets of ancestry informative markers (AIMs), each maximized for the information in one the three contrasts among ancestral populations: Europeans (HAPMAP, CEU), Africans (HAPMAP, YRI and LWK), and Native Americans (full heritage Pima Indians). We estimate IGA and present an algorithm for their standard errors, compare IGA to principal components, emphasize the importance of balancing information in the ancestry informative markers (AIMs), and test the association of IGA with diabetic nephropathy in the combined sample.
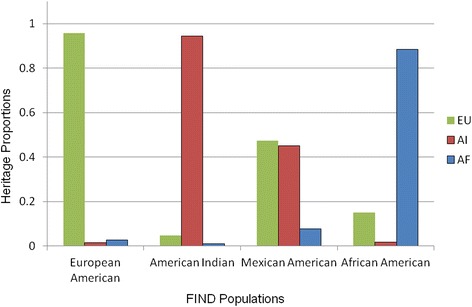
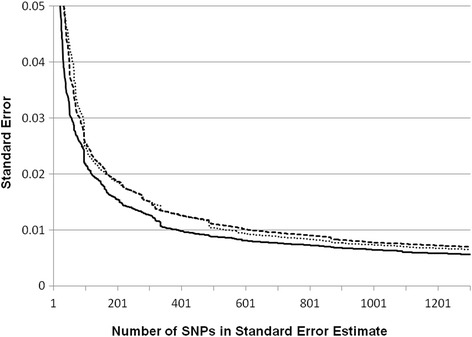
Results: A fixed parental allele maximum likelihood algorithm was applied to the FIND to estimate IGA in four samples: 869 American Indians; 1385 African Americans; 1451 Mexican Americans; and 826 European Americans. When the information in the AIMs is unbalanced, the estimates are incorrect with large error. Individual genetic admixture is highly correlated with principle components for capturing population structure. It takes ~700 SNPs to reduce the average standard error of individual admixture below 0.01. When the samples are combined, the resulting population structure creates associations between IGA and diabetic nephropathy.
Conclusions: The identified set of AIMs, which include American Indian parental allele frequencies, may be particularly useful for estimating genetic admixture in populations from the Americas. Failure to balance information in maximum likelihood, poly-ancestry models creates biased estimates of individual admixture with large error. This also occurs when estimating IGA using the Bayesian clustering method as implemented in the program STRUCTURE. Odds ratios for the associations of IGA with disease are consistent with what is known about the incidence and prevalence of diabetic nephropathy in these populations.
Keywords: Diabetic nephropathy; Individual genetic ancestry; Population structure; SNP.
Figures
Similar articles
-
A genome-wide search for linkage of estimated glomerular filtration rate (eGFR) in the Family Investigation of Nephropathy and Diabetes (FIND).PLoS One. 2013 Dec 17;8(12):e81888. doi: 10.1371/journal.pone.0081888. eCollection 2013. PLoS One. 2013. PMID: 24358131 Free PMC article.
-
Genome-Wide Association and Trans-ethnic Meta-Analysis for Advanced Diabetic Kidney Disease: Family Investigation of Nephropathy and Diabetes (FIND).PLoS Genet. 2015 Aug 25;11(8):e1005352. doi: 10.1371/journal.pgen.1005352. eCollection 2015 Aug. PLoS Genet. 2015. PMID: 26305897 Free PMC article.
-
Mexican American ancestry-informative markers: examination of population structure and marker characteristics in European Americans, Mexican Americans, Amerindians and Asians.Hum Genet. 2004 Feb;114(3):263-71. doi: 10.1007/s00439-003-1058-6. Epub 2003 Nov 20. Hum Genet. 2004. PMID: 14628215
-
Genetic admixture: a tool to identify diabetic nephropathy genes in African Americans.Ethn Dis. 2008 Summer;18(3):384-8. Ethn Dis. 2008. PMID: 18785456 Review.
-
Genetics of diabetic nephropathy in the Pima Indians.Curr Diab Rep. 2001 Dec;1(3):275-81. doi: 10.1007/s11892-001-0046-2. Curr Diab Rep. 2001. PMID: 12643210 Review.
Cited by
-
Discordance of diabetic retinopathy severity in a cohort of diabetic nephropathy patients: a cross-sectional case-control study in a new Mexican population of type 2 diabetes.Front Endocrinol (Lausanne). 2025 Aug 1;16:1638415. doi: 10.3389/fendo.2025.1638415. eCollection 2025. Front Endocrinol (Lausanne). 2025. PMID: 40822949 Free PMC article.
References
-
- Iyengar SK, Abboud HE, Goddard KA, Saad MF, Adler SG, Arar NH, Bowden DW, Family Investigation of Nephropathy and Diabetes Research Group et al. Genome-wide scans for diabetic nephropathy and albuminuria in multiethnic populations: the family investigation of nephropathy and diabetes (FIND) Diabetes. 2007;56:1577–85. doi: 10.2337/db06-1154. - DOI - PubMed
-
- Iyengar S, Sedor JR, Freedman BI, Kao WHL, Kretzler M, Keller BJ, et al. Genome-wide association and trans-ethnic meta-analysis for advanced diabetic kidney disease: Family Investigation of Nephropathy and Diabetes (FIND) PLoS Genet. 2015;11(8):e1005352. doi: 10.1371/journal.pgen.1005352. - DOI - PMC - PubMed
MeSH terms
Substances
Grants and funding
- U01 DK057304/DK/NIDDK NIH HHS/United States
- R01 DK084149/DK/NIDDK NIH HHS/United States
- R01 DK070941/DK/NIDDK NIH HHS/United States
- U01 DK057295/DK/NIDDK NIH HHS/United States
- U01 DK057300/DK/NIDDK NIH HHS/United States
- F32 DK080617/DK/NIDDK NIH HHS/United States
- U01 DK057303/DK/NIDDK NIH HHS/United States
- P30 DK079626/DK/NIDDK NIH HHS/United States
- UL1 TR000124/TR/NCATS NIH HHS/United States
- U01 DK057249/DK/NIDDK NIH HHS/United States
- P30 DK063491/DK/NIDDK NIH HHS/United States
- R01 HL062985/HL/NHLBI NIH HHS/United States
- U01 DK070657/DK/NIDDK NIH HHS/United States
- M01 RR001346/RR/NCRR NIH HHS/United States
- U01 DK057298/DK/NIDDK NIH HHS/United States
- N01 HG065403/HG/NHGRI NIH HHS/United States
- U01 DK057329/DK/NIDDK NIH HHS/United States
- M01 RR007122/RR/NCRR NIH HHS/United States
- M01 RR000425/RR/NCRR NIH HHS/United States
- R01 DK053591/DK/NIDDK NIH HHS/United States
- M01 RR000997/RR/NCRR NIH HHS/United States
- UL1 TR001120/TR/NCATS NIH HHS/United States
- R01 HS008365/HS/AHRQ HHS/United States
- U01 DK057292/DK/NIDDK NIH HHS/United States
- M01 RR000827/RR/NCRR NIH HHS/United States
- M01 RR000080/RR/NCRR NIH HHS/United States
LinkOut - more resources
Full Text Sources
Other Literature Sources
Medical
Miscellaneous
