. 2016 May 3:17:83.
doi: 10.1186/s13059-016-0939-7.

Single-cell profiling of human megakaryocyte-erythroid progenitors identifies distinct megakaryocyte and erythroid differentiation pathways

Affiliations

Single-cell profiling of human megakaryocyte-erythroid progenitors identifies distinct megakaryocyte and erythroid differentiation pathways

Bethan Psaila et al. Genome Biol. .

Abstract

Background: Recent advances in single-cell techniques have provided the opportunity to finely dissect cellular heterogeneity within populations previously defined by "bulk" assays and to uncover rare cell types. In human hematopoiesis, megakaryocytes and erythroid cells differentiate from a shared precursor, the megakaryocyte-erythroid progenitor (MEP), which remains poorly defined.

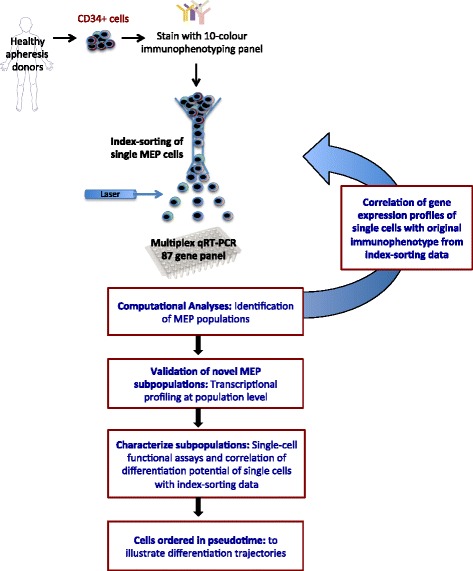
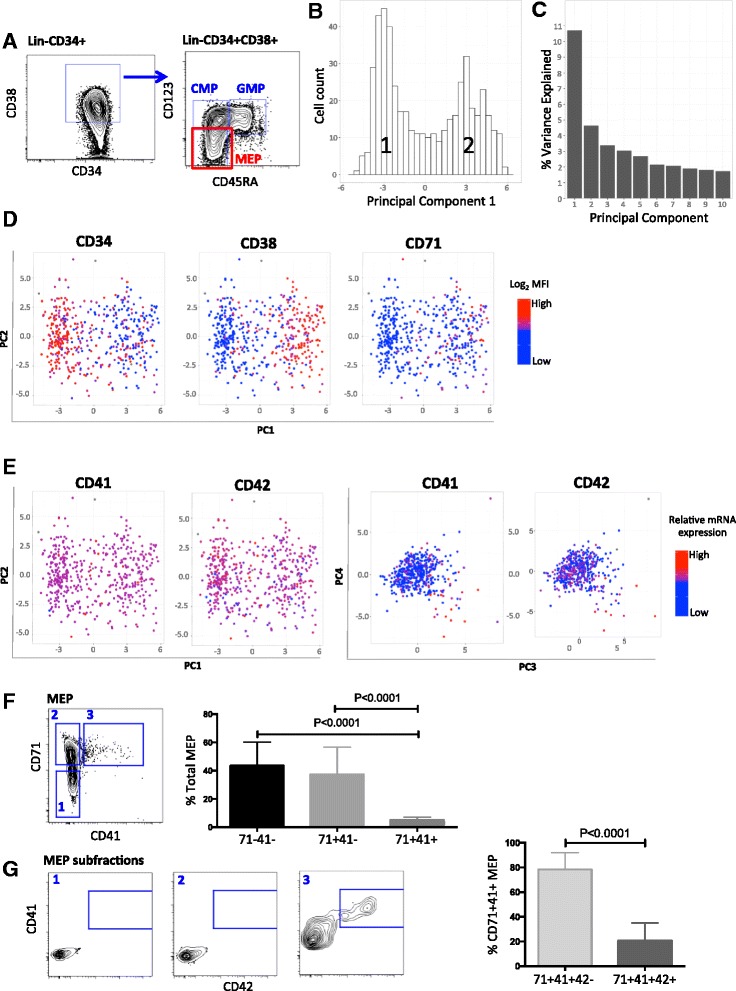
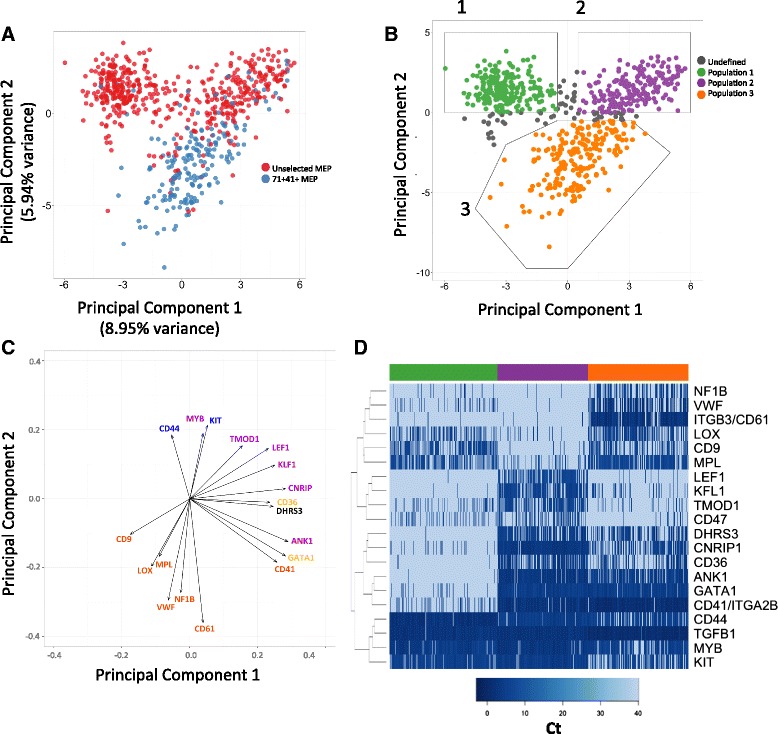
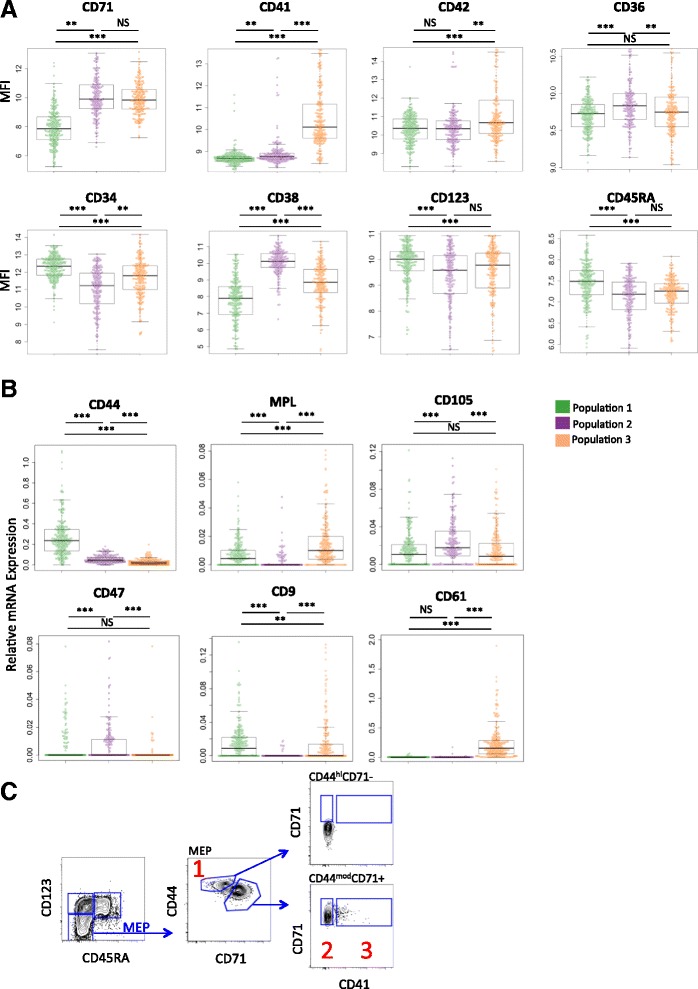
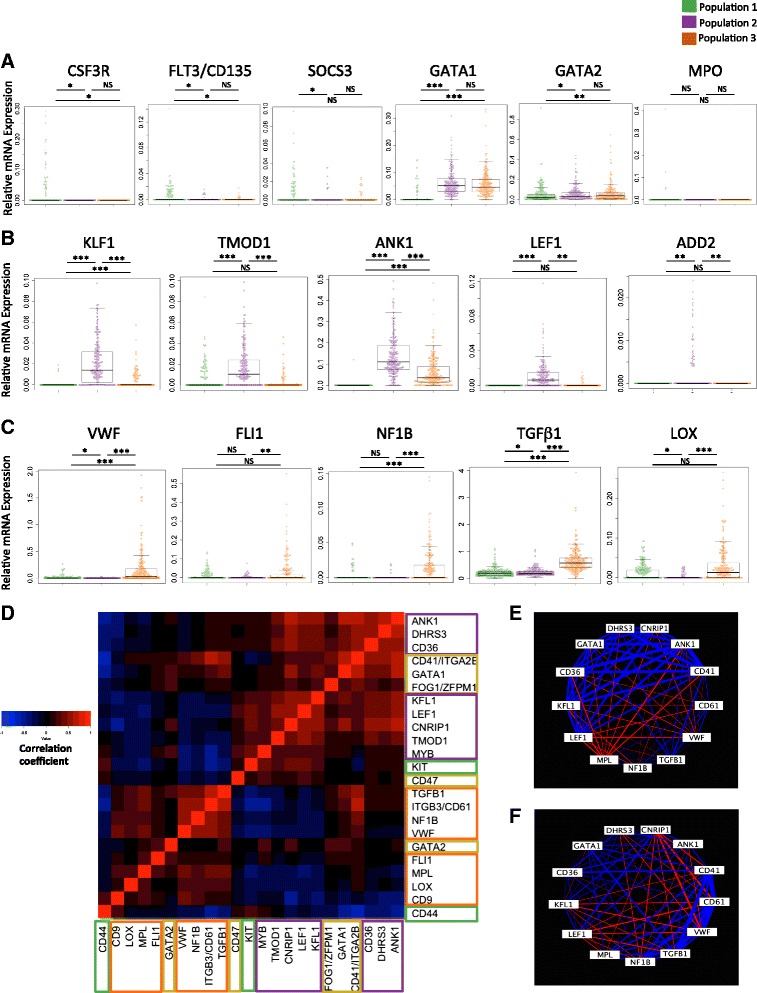
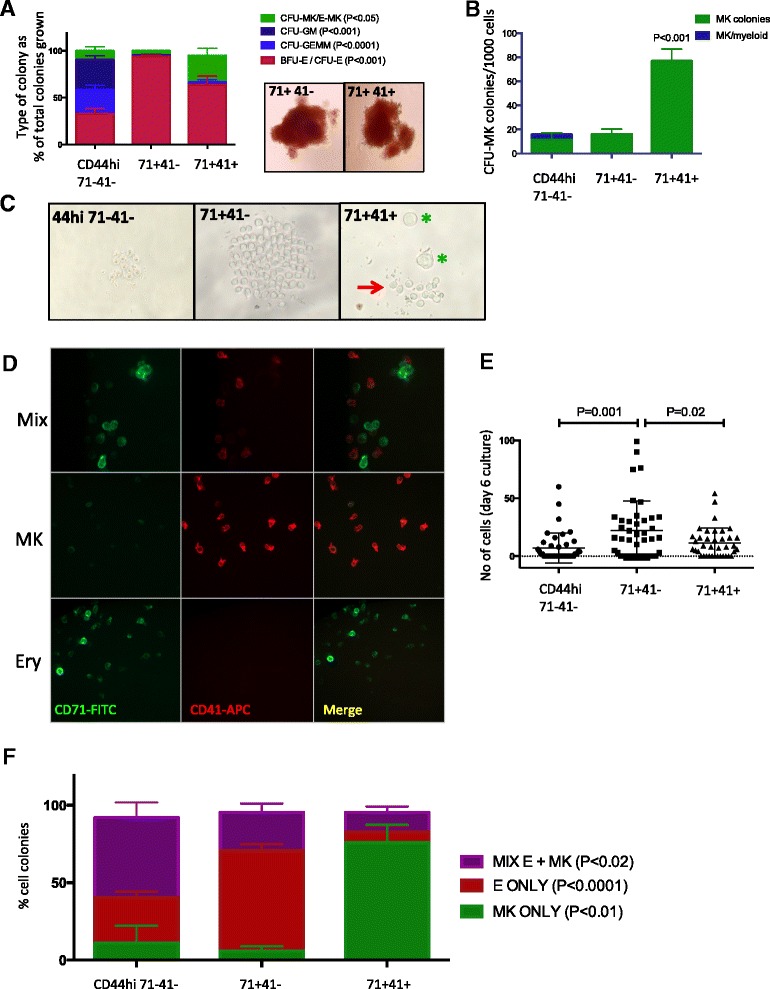
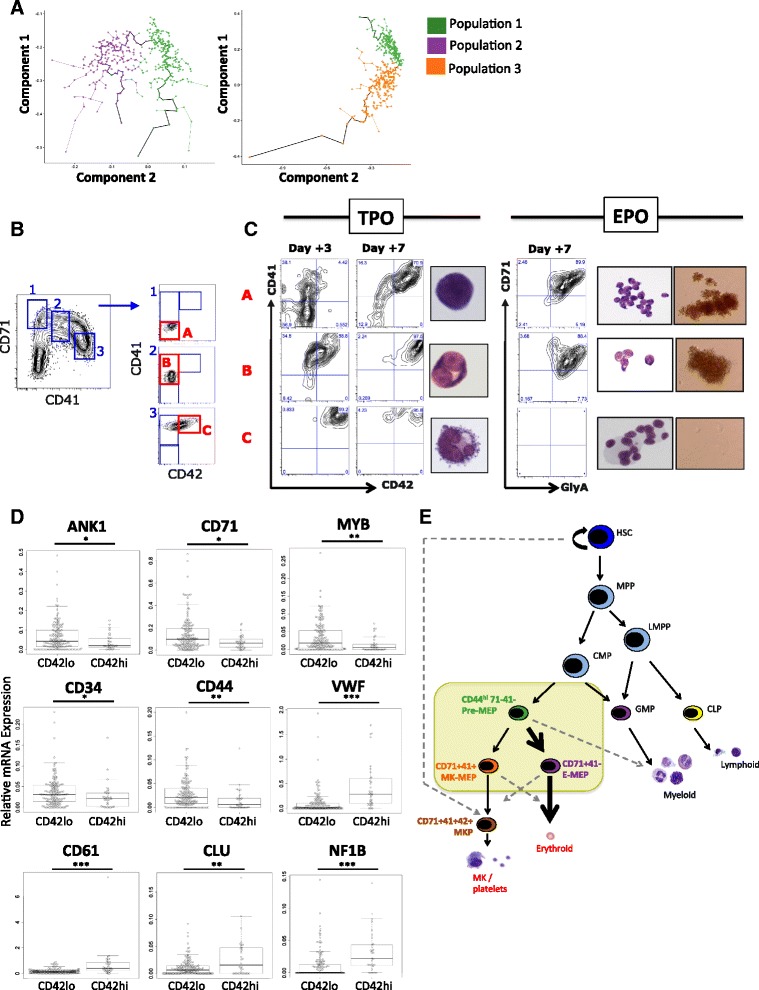
Results: To clarify the cellular pathway in erythro-megakaryocyte differentiation, we correlate the surface immunophenotype, transcriptional profile, and differentiation potential of individual MEP cells. Highly purified, single MEP cells were analyzed using index fluorescence-activated cell sorting and parallel targeted transcriptional profiling of the same cells was performed using a specifically designed panel of genes. Differentiation potential was tested in novel, single-cell differentiation assays. Our results demonstrate that immunophenotypic MEP comprise three distinct subpopulations: "Pre-MEP," enriched for erythroid/megakaryocyte progenitors but with residual myeloid differentiation capacity; "E-MEP," strongly biased towards erythroid differentiation; and "MK-MEP," a previously undescribed, rare population of cells that are bipotent but primarily generate megakaryocytic progeny. Therefore, conventionally defined MEP are a mixed population, as a minority give rise to mixed-lineage colonies while the majority of cells are transcriptionally primed to generate exclusively single-lineage output.

Conclusions: Our study clarifies the cellular hierarchy in human megakaryocyte/erythroid lineage commitment and highlights the importance of using a combination of single-cell approaches to dissect cellular heterogeneity and identify rare cell types within a population. We present a novel immunophenotyping strategy that enables the prospective identification of specific intermediate progenitor populations in erythro-megakaryopoiesis, allowing for in-depth study of disorders including inherited cytopenias, myeloproliferative disorders, and erythromegakaryocytic leukemias.

Keywords: Hematopoiesis; erythropoiesis; hematopoietic stem cell; megakaryopoiesis; myelopoiesis; thrombopoiesis.


Figures

Fig. 1
Fig. 1
Overview of the experimental strategy. CD34+ cells from healthy, mobilized apheresis donors were immunostained with a 10-fluorochrome panel and single cells were index-sorted into 96-well PCR plates for multiplex qRT-PCR analysis using the Fluidigm Biomark platform. MEP subpopulations were identified by principal component analysis (PCA) and correlated with the original index sorting data and mRNA levels of surface antigens. Identified cellular subsets were validated transcriptionally at the population level and functionally in single-cell differentiation assays. Finally, the cells were ordered in pseudotime to assess differentiation trajectories which were then further validated in functional assays. FACS, fluorescence-activated cell sorting; IF, immunofluorescence; qRT-PCR, quantitative real-time polymerase chain reaction
Fig. 2
Fig. 2
Single-cell gene expression analysis demonstrates significant cellular heterogeneity and the presence of subpopulations within classically defined, immunophenotypic MEP. a A previously validated strategy was used to distinguish MEP from the other lineage-negative (Lin-) CD34+ CD38+ myeloid progenitor populations—common myeloid (CMP) and granulocyte-macrophage progenitors (GMP)—by the absence of CD123 and CD45RA. Quantification gates are shown (sorting gates are shown in Additional file 1: Figure S1A). b Multiplex qPCR of 87 genes in 489 Lin- CD34 + CD38 + CD123- CD45RA-MEP cells and PCA was performed. The distribution of cells along PC 1 demonstrates two distinct cellular populations (annotated 1 and 2). c Plot showing % variance by PCs 1–10. d Superimposition of mean log2 fluorescence intensity (MFI) values of the original cells isolated for qPCR on the PCA for PC1 and PC2 reveals that the two populations have distinct expression profiles for CD34, CD38, and CD71. e Superimposition of CD41 and CD42 expression on the PCA for PC1 vs. PC2 (MFI, left plots) indicated rare cells with high CD41 and CD42 expression which did not fall into either Population 1 or 2, suggesting the presence of smaller subpopulation(s) expressing megakaryocyte-associated antigens. CD41high and CD42high cells segregated more distinctly by PC3 vs. PC4 (relative mRNA expression, right plots). Red-blue scale indicates high to low expression (customized for each plot in 2D and 2E). f Representative flow plot (left) illustrating differential expression of CD71 and CD41 within immunophenotypic MEP compartment, identifying three subpopulations: (1) CD71-CD41-; (2) CD71 + 41- ; and (3) CD71 + 41+. Quantification of these three subpopulations (right) in CD34+ cells from 14 healthy donors. Cells falling between FACS gates are excluded from the chart. CD71 + 41 + MEP are significantly less frequent, constituting 5.1 ± 0.6 % of total MEP (mean ± SEM, P <0.0001). g Expression of CD42 in the three MEP subfractions. CD42 expression is restricted to a minority (20.7 ± 4.1 %) of CD71 + CD41 + MEP cells (P <0.0001)
Fig. 3
Fig. 3
MEP contain three distinct subpopulations segregated by differential expression of megakaryocyte and erythroid-associated genes. a PCA of 681 cells showing distribution of unselected MEP cells (n = 489; red) and CD71 + 41+ selected MEP (n = 192; blue) for PC 1 (8.95 % variance) and PC2 (5.94 % variance). CD71 + 41+ MEP are distinct from Populations 1 and 2. b The three subpopulations that emerged from the PCA (Fig. 2a) were defined as Populations 1 (green), 2 (purple), and 3 (orange) on the basis of PC1 and PC2 values. c The 18 most highly weighted genes in PC1 and 2 show that the distinction of the populations is driven by differential expression of key megakaryocyte (orange font) and erythroid-associated (purple font) genes. Blue font indicates genes associated with more primitive cellular phenotype (CD44 and KIT). Black indicates an MEP gene (DHRS3) and yellow (GATA1, CD36) genes expressed in both megakaryocytic and erythroid cells. d Heatmap of Ct values shows differential gene expression of 20 selected genes between the three populations identified on the PCA. (Green, Population 1; purple, Population 2; orange, Population 3)
Fig. 4
Fig. 4
Cell surface antigen expression discriminates the three MEP subpopulations identified by single-cell gene expression analysis. a Mean fluorescence intensity (MFI) of eight surface antigens included in the FACS panel for the three populations assigned by PCA. Population 1 (green) contained cells with significantly higher CD34, CD123, and CD45RA and lowest CD38, CD71, CD41, and CD42 expression. Population 2 (purple) identified as CD71 + 41- and Population 3 (orange) as CD71 + 41+. b Cell surface antigens included in the qPCR profile panel but not the FACS panel were considered to further refine the immunophenotyping strategy. CD44 expression emerged from the qPCR data as the most differentially expressed surface antigen associated with Population 1 (P <0.0001). Star indicators represent significance values (KS test with FDR correction) between populations: *-q <0.05; **-q <0.01; ***-q <0.001; NS-q >0.05. Data are shown as bee-swarm plots in which the log2 MFI values (a) or relative mRNA expression level (b) of individual cells are represented as dots with a box plot overlaid. c The utility of CD44 immunophenotyping was validated by flow cytometry, confirming that high surface expression of CD44 correlates with the CD71- CD41- MEP subfraction. Numbers shown correspond to the three MEP subsets: Population 1, CD44hi 71- 41- ; population 2, CD71 + 41-; population 3, CD71 + 41+
Fig. 5
Fig. 5
Distinct erythroid-associated and megakaryocyte-associated transcriptional lineage-priming in MEP subpopulations. a Population 1 (green) contained cells with residual CSF3R, FLT3/CD135, and SOCS3 expression and lowest GATA1 and GATA2 expression, suggesting that this population comprises progenitors earlier in the hematopoietic hierarchy than populations 2 and 3 and more closely related to CMP. Expression of myeloperoxidase (MPO) was only detected in five of 681 cells, indicating minimal contamination of the FACS-isolated MEP cells with CMP or other myeloid lineage cells, in which MPO is strongly positive [20]. b The highest levels of expression of erythroid genes, including KLF1, TMOD1, ANK1, LEF1, and ADD2 were observed in Population 2 (purple). c The highest levels of expression of megakaryocyte genes, including VWF, FLI1, NFIB, TGFB1, and LOX occurred in Population 3 (orange). Each chart shows a bee-swarm plot where each dot represents the gene expression of an individual cell, with a box plot overlaid. Significance values are shown for q-values for KS test with FDR correction between populations: *-q <0.05; **-q <0.01; ***-q <0.001; NS-q >0.05. d Heatmap showing correlation of expression of selected erythroid and megakaryocytic genes within single cells. Color-coding: Orange box, megakaryocyte gene set; purple, erythroid; yellow, both megakaryocyte and erythroid; green, genes associated with pre-MEP phenotype. e, f Representation of Spearman correlation coefficient between selected genes in populations 2 (Fig. 5e) and 3 (Fig. 5f), respectively. Blue edges denote positive correlation and red edges denote negative correlation. Edge thickness is a function of correlation magnitude
Fig. 6
Fig. 6
Single-cell functional assays confirm erythroid and megakaryocyte differentiation bias of CD71 + 41- MEP and CD71 + 41+ MEP, whereas CD44hi71- 41- MEP demonstrate a “Pre-MEP” phenotype. a Colony-forming capacity of single MEP cells in methylcellulose, which primarily supports erythroid and myeloid differentiation. Left graph: colony phenotype as a percentage of total colonies grown. The percentage of erythroid colonies (BFU-E/CFU-E; red) was significantly higher for CD71 + 41- MEP than the other two populations. CD44hiCD71-41- MEP cells generated a higher percentage of myeloid colonies (CFU-GEMM/GM; blue) than the CD71+ fractions. Photographs show representative BFU-Es derived from single CD71 + 41- and CD71 + 41+ cells. Data shown are for 30–60 single cells sorted from each population in each of seven separate experiments. b Megakaryocyte colony-forming potential was tested in a collagen-based assay supporting megakaryocyte and myeloid but not erythroid colonies. CD71 + 41+ MEP cells gave rise to significantly more megakaryocyte colonies (green; n = 4). c Typical cell cultures 6 days after seeding of single cells from MEP subsets into a liquid culture system supporting erythroid and megakaryocytic differentiation. An example of a mixed megakaryocyte and erythroid colony is shown for CD71 + 41+ MEP, with two large, proplatelet-forming megakaryocytes (green stars) and several smaller erythroblasts (red arrow). The example colonies shown for CD44hiCD71- CD41- and CD71 + CD41- MEP are exclusively erythroid, with a higher proliferation rate in the CD71 + 41- colony. d The identity of cells in individual culture wells was determined by immunofluorescence (IF) microscopy, flow cytometry, and morphology. Example IF images of mixed (Mix, top), megakaryocyte-only (MK, middle), and erythroid-only (Ery, bottom) cultures. Cells immunostained for CD71 (FITC, green) and CD41(APC, red). e Cell number in each well 6 days after seeding with a single cell. CD71 + 41- MEP are most proliferative. N = 3. f Summary FACS data for 100 single-cell colonies analyzed (n = 3). CD44hiCD71- 41-MEP most frequently generated mixed erythroid/megakaryocyte colonies; CD71 + 41- showed mostly erythroid-only and CD71 + 41+ showed primarily MK-only progeny. P values are for one-way ANOVA between populations
Fig. 7
Fig. 7
Monocle trajectory analysis and sequential cultures identify a novel megakaryocyte-committed progenitor population. a Pseudo-temporal ordering of cells using Monocle [37]. Trajectories are shown for Population 1 to 2 (Pre-MEP to E-MEP; left plot) and Population 1 to 3 (Pre-MEP to MK-MEP; right plot). b CD71 + 41- 42- (Population A), CD71 + 41 + 42- (Population B), and CD71midCD41hiCD42+ (Population C) were FACS-isolated from day 4 in vitro megakaryocyte cultures for secondary culture and re-plated in either TPO-based (no EPO, left) or EPO-based (no TPO, right) cultures. c Left: 3 and 7 days after re-plating in TPO medium, Populations A, B, and C demonstrated progressive megakaryocytic maturity. Population A gave rise to CD41 + CD42-/+ megakaryocytes; b and c showed progressive CD42 acquisition supporting a unidirectional differentiation hierarchy. Photographs show representative cell cytospins 3 days after secondary culture. Population A shows early megakaryoblasts; Population B shows CD41+ CD42+/- megakaryocytes with single/bi-lobulated nuclei; Population C shows mature, proplatelet-forming megakaryocytes, multilobulated nuclei. Right: In parallel, Populations A, B, and C were re-plated into EPO-based secondary cultures (without TPO) and methylcellulose to test erythropoietic potential. A and B gave rise to CD71 + GlyA+ progeny with typical erythroblast morphology and BFU-Es; C were unable to differentiate into erythroid cells and were immunophenotypically/morphologically identifiable as CD41 + 42+ polyploid megakaryocytes (with abnormal nuclear lobe separation). n = 4. d Expression of selected genes in the MK-MEP subpopulation stratified according to CD42 cell surface expression. CD71 + 41 + CD42+ cells showed significantly lower expression of erythroid genes (e.g. ANK1, CD71, MYB), genes associated with more primitive HSC/progenitors (e.g. CD34, CD44) and higher expression of megakaryocyte genes (e.g. VWF, CD61, CLU, NF1B) than CD71 + 41 + CD42- cells. e A revised model of the megakaryocyte-erythroid differentiation hierarchy showing replacement of classically defined MEP with three novel subpopulations (yellow box). Arrows represent weighted differentiation capability; dashed arrows represent the potential for alternate-lineage differentiation. CLP, common lymphoid progenitors; CMP, common myeloid progenitors; E, erythroid; GMP, granulocyte/macrophage progenitors; HSC, hematopoietic stem cells; LMPP, lymphoid-primed multipotent progenitors; MEP, megakaryocyte-erythroid progenitors; MK, megakaryocyte; MPP, multipotent progenitors

Similar articles

Cited by

References

    1. Weissman IL, Anderson DJ, Gage F. Stem and progenitor cells: origins, phenotypes, lineage commitments, and transdifferentiations. Annu Rev Cell Dev Biol. 2001;17:387–403. doi: 10.1146/annurev.cellbio.17.1.387. - DOI - PubMed
    1. Debili N, Coulombel L, Croisille L, Katz A, Guichard J, Breton-Gorius J, et al. Characterization of a bipotent erythro-megakaryocytic progenitor in human bone marrow. Blood. 1996;88:1284–1296. - PubMed
    1. Notta F, Zandi S, Takayama N, Dobson S, Gan OI, Wilson G, et al. Distinct routes of lineage development reshape the human blood hierarchy across ontogeny. Science. 2015 - PMC - PubMed
    1. Buettner F, Natarajan KN, Casale FP, Proserpio V, Scialdone A, Theis FJ, et al. Computational analysis of cell-to-cell heterogeneity in single-cell RNA-sequencing data reveals hidden subpopulations of cells. Nat Biotechnol. 2015;33:155–160. doi: 10.1038/nbt.3102. - DOI - PubMed
    1. Stegle O, Teichmann SA, Marioni JC. Computational and analytical challenges in single-cell transcriptomics. Nat Rev Genet. 2015;16:133–145. doi: 10.1038/nrg3833. - DOI - PubMed

Publication types