Modeling Doxorubicin-Induced Cardiotoxicity in Human Pluripotent Stem Cell Derived-Cardiomyocytes
- PMID: 27142468
- PMCID: PMC4855185
- DOI: 10.1038/srep25333
Modeling Doxorubicin-Induced Cardiotoxicity in Human Pluripotent Stem Cell Derived-Cardiomyocytes
Abstract
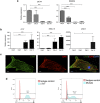
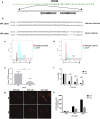
Doxorubicin is a highly efficacious anti-cancer drug but causes cardiotoxicity in many patients. The mechanisms of doxorubicin-induced cardiotoxicity (DIC) remain incompletely understood. We investigated the characteristics and molecular mechanisms of DIC in human pluripotent stem cell-derived cardiomyocytes (hPSC-CMs). We found that doxorubicin causes dose-dependent increases in apoptotic and necrotic cell death, reactive oxygen species production, mitochondrial dysfunction and increased intracellular calcium concentration. We characterized genome-wide changes in gene expression caused by doxorubicin using RNA-seq, as well as electrophysiological abnormalities caused by doxorubicin with multi-electrode array technology. Finally, we show that CRISPR-Cas9-mediated disruption of TOP2B, a gene implicated in DIC in mouse studies, significantly reduces the sensitivity of hPSC-CMs to doxorubicin-induced double stranded DNA breaks and cell death. These data establish a human cellular model of DIC that recapitulates many of the cardinal features of this adverse drug reaction and could enable screening for protective agents against DIC as well as assessment of genetic variants involved in doxorubicin response.
Figures


Similar articles
-
Variation in RARG increases susceptibility to doxorubicin-induced cardiotoxicity in patient specific induced pluripotent stem cell-derived cardiomyocytes.Sci Rep. 2020 Jun 25;10(1):10363. doi: 10.1038/s41598-020-65979-x. Sci Rep. 2020. PMID: 32587261 Free PMC article.
-
Human induced pluripotent stem cell-derived cardiomyocytes recapitulate the predilection of breast cancer patients to doxorubicin-induced cardiotoxicity.Nat Med. 2016 May;22(5):547-56. doi: 10.1038/nm.4087. Epub 2016 Apr 18. Nat Med. 2016. PMID: 27089514 Free PMC article.
-
Use of Human Pluripotent Stem Cell Derived-Cardiomyocytes to Study Drug-Induced Cardiotoxicity.Curr Protoc Toxicol. 2017 Aug 4;73:22.5.1-22.5.22. doi: 10.1002/cptx.30. Curr Protoc Toxicol. 2017. PMID: 28777443
-
Maturation of Pluripotent Stem Cell-Derived Cardiomyocytes: a Critical Step for Drug Development and Cell Therapy.J Cardiovasc Transl Res. 2018 Oct;11(5):375-392. doi: 10.1007/s12265-018-9801-5. Epub 2018 Mar 19. J Cardiovasc Transl Res. 2018. PMID: 29557052 Review.
-
CRISPR/Cas9-mediated genome editing in human stem cell-derived cardiomyocytes: Applications for cardiovascular disease modelling and cardiotoxicity screening.Drug Discov Today Technol. 2018 Aug;28:13-21. doi: 10.1016/j.ddtec.2018.06.002. Epub 2018 Jun 25. Drug Discov Today Technol. 2018. PMID: 30205876 Review.
Cited by
-
Integrating cardiomyocytes from human pluripotent stem cells in safety pharmacology: has the time come?Br J Pharmacol. 2017 Nov;174(21):3749-3765. doi: 10.1111/bph.13577. Epub 2016 Sep 20. Br J Pharmacol. 2017. PMID: 27641943 Free PMC article. Review.
-
Pediatric Anthracycline-Induced Cardiotoxicity: Mechanisms, Pharmacogenomics, and Pluripotent Stem-Cell Modeling.Clin Pharmacol Ther. 2019 Mar;105(3):614-624. doi: 10.1002/cpt.1311. Epub 2019 Jan 11. Clin Pharmacol Ther. 2019. PMID: 30460992 Free PMC article. Review.
-
Effects of doxorubicin-induced cardiotoxicity on cardiac mitochondrial dynamics and mitochondrial function: Insights for future interventions.J Cell Mol Med. 2020 Jun;24(12):6534-6557. doi: 10.1111/jcmm.15305. Epub 2020 Apr 26. J Cell Mol Med. 2020. PMID: 32336039 Free PMC article. Review.
-
Improving cardiotoxicity prediction in cancer treatment: integration of conventional circulating biomarkers and novel exploratory tools.Arch Toxicol. 2021 Mar;95(3):791-805. doi: 10.1007/s00204-020-02952-7. Epub 2020 Nov 21. Arch Toxicol. 2021. PMID: 33219404 Review.
-
Intensive care for human hearts in pluripotent stem cell models.NPJ Regen Med. 2020 Mar 6;5:4. doi: 10.1038/s41536-020-0090-7. eCollection 2020. NPJ Regen Med. 2020. PMID: 32194989 Free PMC article. Review.
References
-
- Singal P. K., Iliskovic N., Li T. & Kumar D. Adriamycin cardiomyopathy: pathophysiology and prevention. FASEB J. 11, 931–936 (1997). - PubMed
-
- Force T. & Kolaja K. L. Cardiotoxicity of kinase inhibitors: the prediction and translation of preclinical models to clinical outcomes. Nat. Rev. Drug Discov. 10, 111–126 (2011). - PubMed
-
- Kim S.-Y. et al. Doxorubicin-induced reactive oxygen species generation and intracellular Ca2+ increase are reciprocally modulated in rat cardiomyocytes. Exp. Mol. Med. 38, 535–545 (2006). - PubMed
-
- Zhang S. et al. Identification of the molecular basis of doxorubicin-induced cardiotoxicity. Nature Medicine 18, 1639–1642 (2012). - PubMed
Publication types
MeSH terms
Substances
LinkOut - more resources
Full Text Sources
Other Literature Sources
Molecular Biology Databases

