. 2016 May 4:17:322.
doi: 10.1186/s12864-016-2674-6.

Transcriptome analysis indicated that Salmonella lipopolysaccharide-induced thymocyte death and thymic atrophy were related to TLR4-FOS/JUN pathway in chicks

Affiliations

Transcriptome analysis indicated that Salmonella lipopolysaccharide-induced thymocyte death and thymic atrophy were related to TLR4-FOS/JUN pathway in chicks

Haibo Huang et al. BMC Genomics. .

Abstract

Background: Thymus is the crucial site for T cell development and once believed to be immune privileged. Recently, thymus has gained special attention as it is commonly targeted by infectious agents which may cause pathogenic tolerance and subsequent immunosuppression.

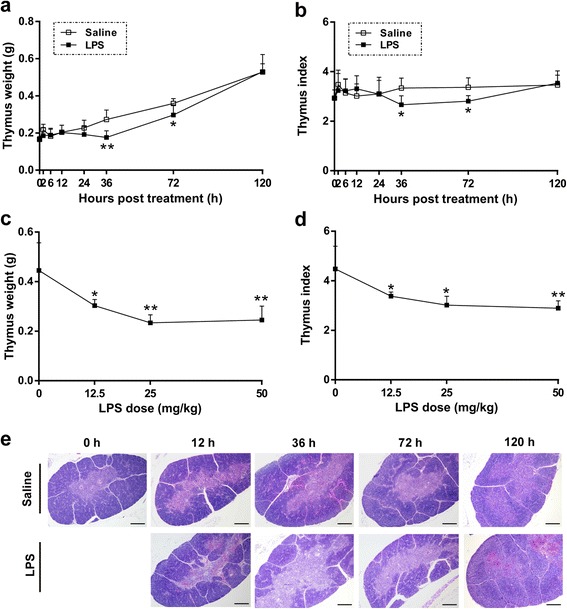
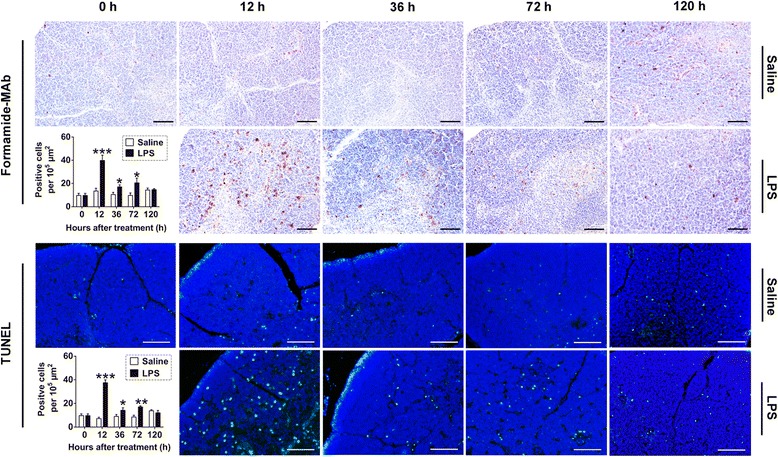
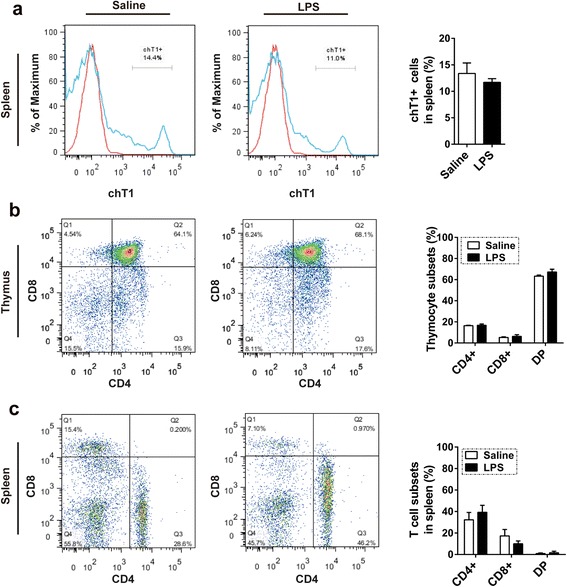
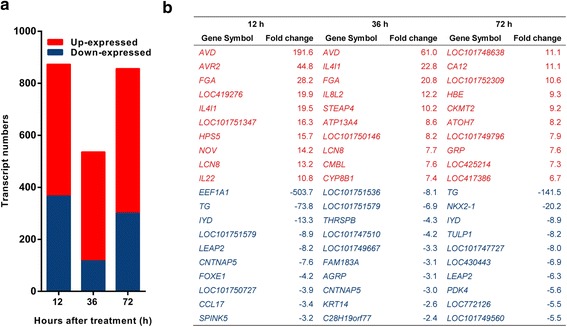
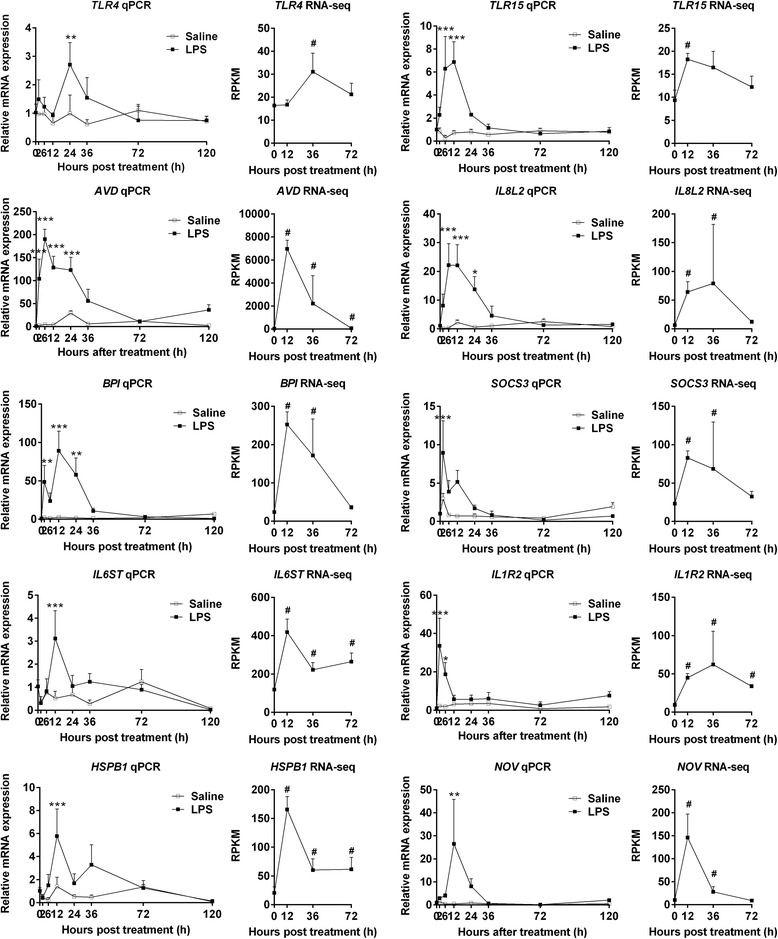
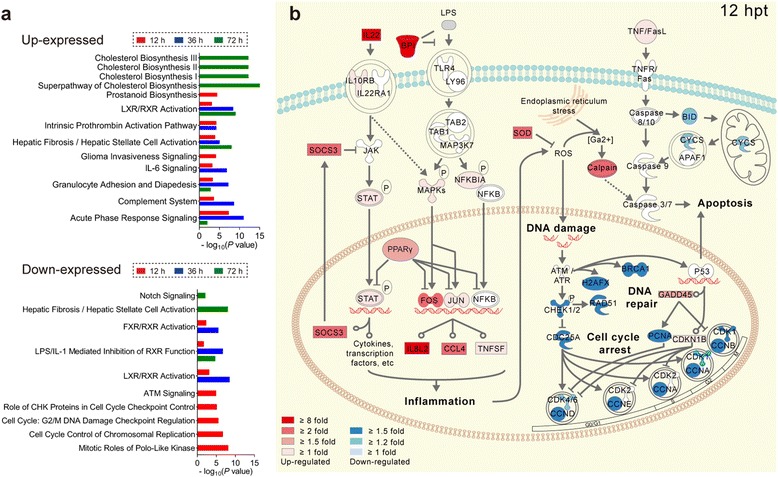
Results: We analyzed thymic responses to the challenge with Salmonella typhimurium (STm) or lipopolysaccharide (LPS) derived from STm in chicks. Newly hatched chicks were injected intraperitoneally with 5 × 10(4) CFU/mL STm or 50 mg/kg LPS. After LPS treatment, maximum thymocyte death (3 ~ 5-fold change) compared to controls was found at 12 h, and maximum loss of thymic weight (35 %) and reduced thymic index (20 %) were found at 36 h. After STm infection, maximum thymocyte death and thymic atrophy occurred at 36 and 72 h, respectively. No significant changes of thymic structure, chT1+ and CD4+/CD8+ T cell ratio were observed in thymus or spleen tissues after LPS treatment. Furthermore, transcriptome analysis revealed important roles for the TLR4-FOS/JUN signaling pathway in thymic injury. Thus, the major process of thymic atrophy in this study first involved activation of transcriptional factors FOS/JUN upon LPS binding to TLR4 that caused release of inflammatory factors, thereby inducing inflammatory responses and DNA damage and ultimately cell cycle arrest and thymic injury.

Conclusions: STm and Salmonella LPS could induce acute chick thymic injury. LPS treatment acted faster than STm. TLR4-FOS/JUN pathway may play an important role in LPS induced chick thymic injury.

Keywords: Salmonella typhimurium; Thymus injury; Transcriptome; chT1.


Figures

Fig. 1
Fig. 1
Salmonella LPS induced acute thymic atrophy in chicks. Newly hatched chicks were injected i.p. with saline or Salmonella LPS and then sacrificed at defined time points to analyze thymus weight and index. a, b LPS treatment (50 mg/kg) reduced thymus weight (a) and index (b) in chicks (n = 4 ~ 6) at 36 and 72 hpt. Statistically significant differences between LPS and saline groups at each time point were determined using Student’s t-test. (c, d) LPS treatment decreased chick thymic weight (c) and index (d) in a dose-dependent manner (n = 3 ~ 5) at 36 hpt. Statistically significant differences between multiple LPS dose groups versus control group (0 mg/kg LPS) was performed with Bonferroni’s multiple comparisons test after one-way ANOVA test. e Sections of thymuses from LPS (50 mg/kg) or saline treated chicks were stained with hematoxylin and eosin to analyze changes of tissue structure. Light areas represent the medulla, and dark areas represent the cortex. Scale bars = 200 μm. All data are presented as means ± SD. *P < 0.05, **P < 0.01
Fig. 2
Fig. 2
Salmonella LPS induced acute thymocyte death in chicks. Newly hatched chicks were injected i.p. with saline or 50 mg/kg Salmonella LPS and then sacrificed at defined time points (n = 3 ~ 6) to analyze cell death by the formamide-MAb assay and TUNEL assay. The positive cells were mainly distributed in thymic cortex. At least 5 fields in each section of the thymus were sampled, and positive cells per 1 × 105 μm2 in the thymic cortex were quantified. Scale bars = 50 μm. Data are presented as means ± SD. Statistically significant differences between LPS and saline groups at each time point were determined using Student’s t-test. *P < 0.05, **P < 0.01, ***P < 0.001
Fig. 3
Fig. 3
Impact of Salmonella LPS on T cell population in chick thymus and spleen. Newly hatched chicks were injected i.p. with saline or 50 mg/kg Salmonella LPS and then sacrificed at 36 hpt (n = 3) to analyze the impact of Salmonella LPS on chick T cell populations. a chT1+ cell ratios in spleen decreased but not significantly. b, c No significant change of CD4+/CD8+ T cells in chick thymus (b) or spleen (c) was observed. All data are presented as means ± SD. Statistically significant differences between LPS and saline groups at each time point were determined using Student’s t-test
Fig. 4
Fig. 4
Analysis of DETs in chick thymus after Salmonella LPS treatment. Newly hatched chicks were injected i.p. with saline or 50 mg/kg Salmonella LPS and then sacrificed at defined time points (n = 7 ~ 9) to perform transcriptome analysis of the thymus. DETs were determined using the MARS model in DEGseq package between different time points (12 hpt vs. 0 hpt, 36 hpt vs. 0 hpt, 72 hpt vs. 0 hpt) with the same cut-off (P < 0.001, absolute fold change ≥ 1.5). a Numbers of DETs at different time point. b Top ten up- and down-expressed genes at different time point. The positive values indicate up-expression and negative values indicate down-expression
Fig. 5
Fig. 5
Confirmation of thymic DETs by qPCR. The qPCR analysis was conducted on ten genes (TLR4, TLR15, AVD, IL8L2, BPI, SOCS3, IL6ST, IL1R2, HSPB1 and NOV) at 8 time points including 0, 2, 6, 12, 24, 36, 72 and 120 h after LPS challenge. Statistically significant differences for multiple comparisons (12 hpt vs. 0 hpt, 36 hpt vs. 0 hpt, 72 hpt vs. 0 hpt) were performed with Bonferroni’s multiple comparisons test after one-way ANOVA test. *P < 0.05, **P < 0.01, ***P < 0.001. RNA-seq was performed for the thymuses collected at 4 time points including 0, 12, 36, and 72 h after LPS challenge. The P values for transcript expression differences between different time points from RNA-seq were determined using MARS method. # P < 0.001. Results are presented as means ± SD (n = 3)
Fig. 6
Fig. 6
IPA pathway enrichment analysis of DETs in chick thymus after Salmonella LPS treatment. a Up-expressed or down-expressed DETs at each time point (12 hpt vs. 0 hpt, 36 hpt vs. 0 hpt, 72 hpt vs. 0 hpt) were subjected to IPA pathway enrichment analysis separately. The top five significant pathways enriched from up-expressed or down-expressed DETs at each time point are displayed separately. b Merged IPA pathways in the chick thymus at 12 hpt are illustrated based on enrichment analysis of IPA pathways. Red genes represent up-expressed genes, blue depict down-expressed genes and white symbols depict neighboring genes. The color intensity represents the average fold change

References

    1. Gameiro J, Nagib P, Verinaud L. The thymus microenvironment in regulating thymocyte differentiation. Cell Adh Migr. 2010;4(3):382–90. doi: 10.4161/cam.4.3.11789. - DOI - PMC - PubMed
    1. Raviola E, Karnovsky MJ. Evidence for a blood-thymus barrier using electron-opaque tracers. J Exp Med. 1972;136(3):466–98. doi: 10.1084/jem.136.3.466. - DOI - PMC - PubMed
    1. Savino W. The thymus is a common target organ in infectious diseases. PLoS Pathog. 2006;2(6):e62. doi: 10.1371/journal.ppat.0020062. - DOI - PMC - PubMed
    1. Nunes-Alves C, Nobrega C, Behar SM, Correia-Neves M. Tolerance has its limits: how the thymus copes with infection. Trends Immunol. 2013;34(10):502–10. doi: 10.1016/j.it.2013.06.004. - DOI - PMC - PubMed
    1. Hoerr FJ. Clinical aspects of immunosuppression in poultry. Avian Dis. 2010;54(1):2–15. doi: 10.1637/8909-043009-Review.1. - DOI - PubMed

Publication types

MeSH terms

Substances