

Timing of retinal neuronal and axonal loss in MS: a longitudinal OCT study
- PMID: 27142714
- PMCID: PMC4929170
- DOI: 10.1007/s00415-016-8127-y
Timing of retinal neuronal and axonal loss in MS: a longitudinal OCT study
Abstract
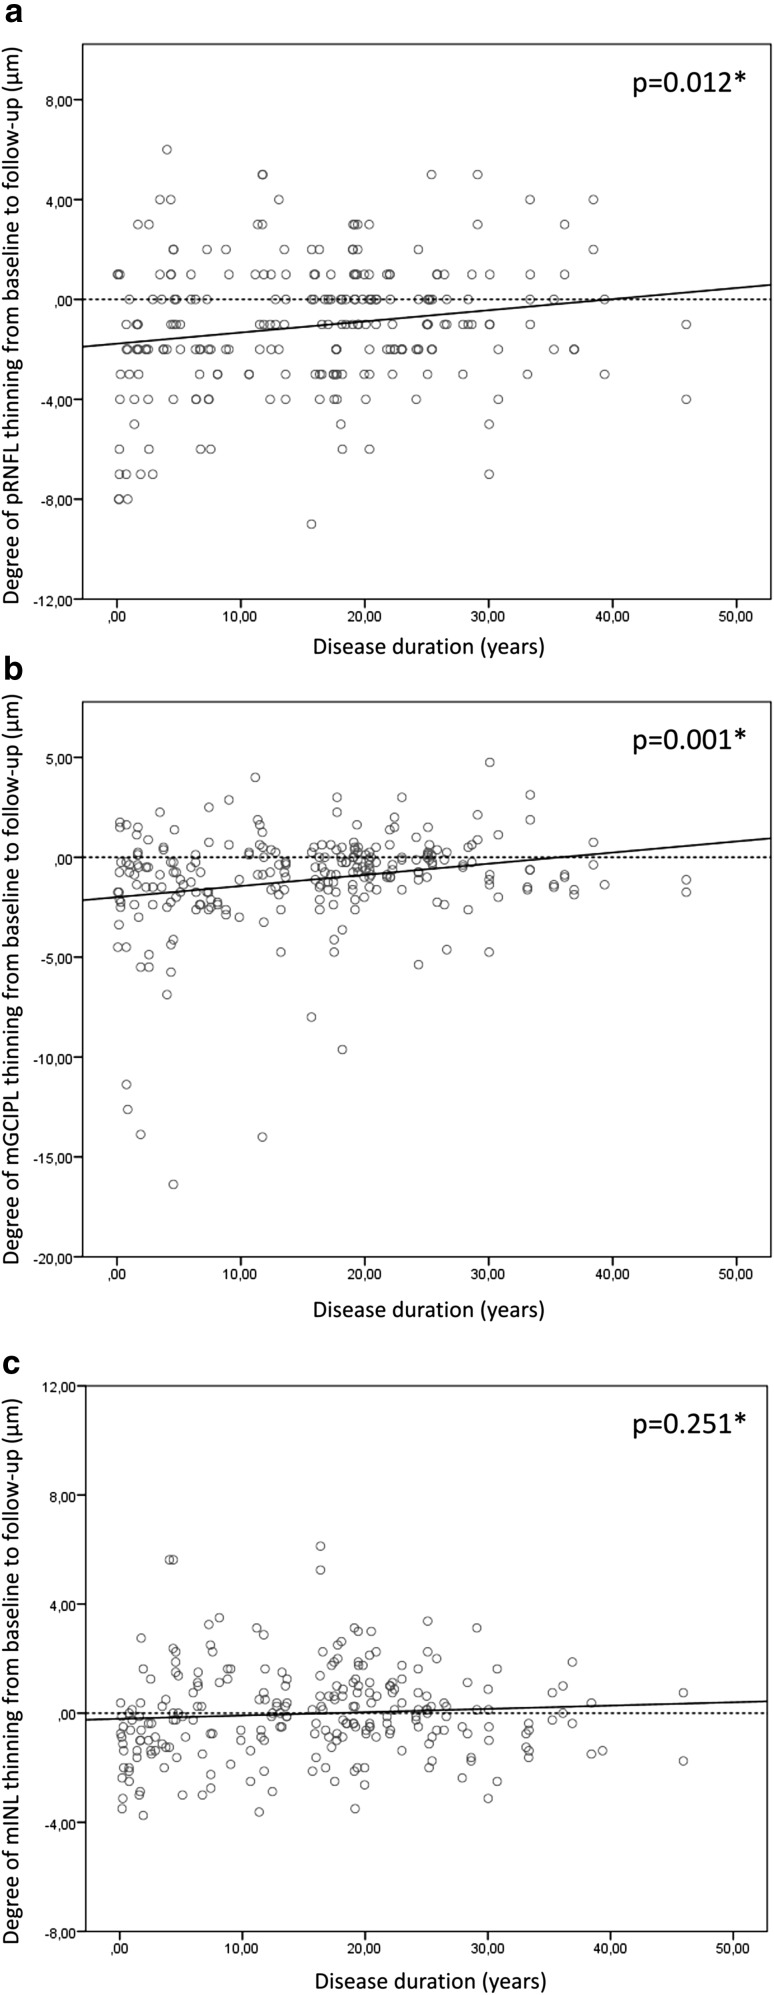
The objective of the study was to investigate the timing of central nervous system tissue atrophy in MS by evaluating longitudinal retinal volume changes in a broadly representative cohort with disease duration across the entire arc of disease. In this longitudinal study, 135 patients with MS and 16 healthy reference subjects underwent spectral-domain optical coherence tomography (OCT) at baseline and 2 years later. Following OCT quality control, automated segmentation of the peripapillary retinal nerve fiber layer (pRNFL), macular ganglion cell-inner plexiform layer (mGCIPL) and macular inner nuclear layer (mINL) was performed. Generalized estimation equations were used to analyze longitudinal changes and associations with disease duration and clinical measures. Participants had a median disease duration at baseline of 16.4 years (range 0.1-45.4). Nearly half (44 %) of the MS patients had previously experienced MS-related optic neuritis (MSON) more than 6 months prior. The MS patients demonstrated a significant decrease over 2 years of the pRNFL (-1.1 µm, 95 % CI 1.4-0.7, p < 0.001) and mGCIPL (-1.1 µm, 95 % CI -1.4 to -0.8, p < 0.001). This thinning was most pronounced early in the course of disease. These findings were irrespective of previous episodes of MSON. No consistent pattern of change was observed for the mINL (-0.03 µm, 95 % CI -0.2 to 0.2, p = 0.795). This longitudinal study demonstrated that injury of the innermost retinal layers is found in MS and that this damage occurs most rapidly during the early stages of disease. The attenuation of atrophy with longer disease duration is suggestive of a plateau effect. These findings emphasize the importance of early intervention to prevent such injury.
Keywords: Multiple sclerosis; Neurodegeneration; Optical coherence tomography; RNFL; Retina.
Figures


Similar articles
-
Predictors of retinal atrophy in multiple sclerosis: A longitudinal study using spectral domain optical coherence tomography with segmentation analysis.Mult Scler Relat Disord. 2018 Apr;21:56-62. doi: 10.1016/j.msard.2018.02.010. Epub 2018 Feb 11. Mult Scler Relat Disord. 2018. PMID: 29459346
-
Cognitive impairment in patients with multiple sclerosis is associated with atrophy of the inner retinal layers.Mult Scler. 2018 Feb;24(2):158-166. doi: 10.1177/1352458517694090. Epub 2017 Feb 1. Mult Scler. 2018. PMID: 28273785 Free PMC article.
-
Retinal layer segmentation in patients with multiple sclerosis using spectral domain optical coherence tomography.Ophthalmology. 2014 Feb;121(2):573-9. doi: 10.1016/j.ophtha.2013.09.035. Epub 2013 Nov 20. Ophthalmology. 2014. PMID: 24268855
-
Optical coherence tomography as a prognostic tool for disability progression in MS: a systematic review.J Neurol. 2023 Feb;270(2):1178-1186. doi: 10.1007/s00415-022-11474-4. Epub 2022 Nov 13. J Neurol. 2023. PMID: 36372866
-
Retinal optical coherence tomography measures in multiple sclerosis: a systematic review and meta-analysis.Ann Clin Transl Neurol. 2024 Sep;11(9):2236-2253. doi: 10.1002/acn3.52165. Epub 2024 Jul 28. Ann Clin Transl Neurol. 2024. PMID: 39073308 Free PMC article.
Cited by
-
The relationship between retinal layer thickness and cognition in patients with multiple sclerosis: A systematic review of current literature.Curr J Neurol. 2023 Jan 5;22(1):50-57. doi: 10.18502/cjn.v22i1.12617. Curr J Neurol. 2023. PMID: 38011353 Free PMC article. Review.
-
Visual outcome measures in clinical trials of remyelinating drugs.BMJ Neurol Open. 2024 Feb 19;6(1):e000560. doi: 10.1136/bmjno-2023-000560. eCollection 2024. BMJ Neurol Open. 2024. PMID: 38389586 Free PMC article. Review.
-
Corneal axonal loss as an imaging biomarker of neurodegeneration in multiple sclerosis: a longitudinal study.Ther Adv Neurol Disord. 2023 Feb 6;16:17562864221118731. doi: 10.1177/17562864221118731. eCollection 2023. Ther Adv Neurol Disord. 2023. PMID: 36776530 Free PMC article.
-
Association of Retinal Architecture, Intrathecal Immunity, and Clinical Course in Multiple Sclerosis.JAMA Neurol. 2017 Jul 1;74(7):847-856. doi: 10.1001/jamaneurol.2017.0377. JAMA Neurol. 2017. PMID: 28460032 Free PMC article.
-
Radiation effects on retinal layers revealed by OCT, OCT-A, and perimetry as a function of dose and time from treatment.Sci Rep. 2024 Feb 9;14(1):3380. doi: 10.1038/s41598-024-53830-6. Sci Rep. 2024. PMID: 38336828 Free PMC article.
References
-
- Petzold A. Neurodegeneration and multiple sclerosis. In: Galimberti D, Scaroini E, editors. Neurodegenerative diseases. London: Springer; 2014. pp. 227–245.
MeSH terms
LinkOut - more resources
Full Text Sources
Other Literature Sources
Medical
