

Whole organism transcriptome analysis of zebrafish models of Bardet-Biedl Syndrome and Alström Syndrome provides mechanistic insight into shared and divergent phenotypes
- PMID: 27142762
- PMCID: PMC4855444
- DOI: 10.1186/s12864-016-2679-1
Whole organism transcriptome analysis of zebrafish models of Bardet-Biedl Syndrome and Alström Syndrome provides mechanistic insight into shared and divergent phenotypes
Abstract
Background: Bardet-Biedl Syndrome (BBS) and Alström Syndrome are two pleiotropic ciliopathies with significant phenotypic overlap between them across many tissues. Although BBS and Alström genes are necessary for the proper function of primary cilia, their role in defects across multiple organ systems is unclear.
Methods: To provide insight into the pathways underlying BBS and Alström phenotypes, we carried out whole organism transcriptome analysis by RNA sequencing in established zebrafish models of the syndromes.
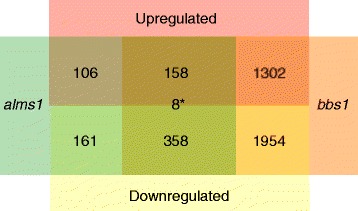
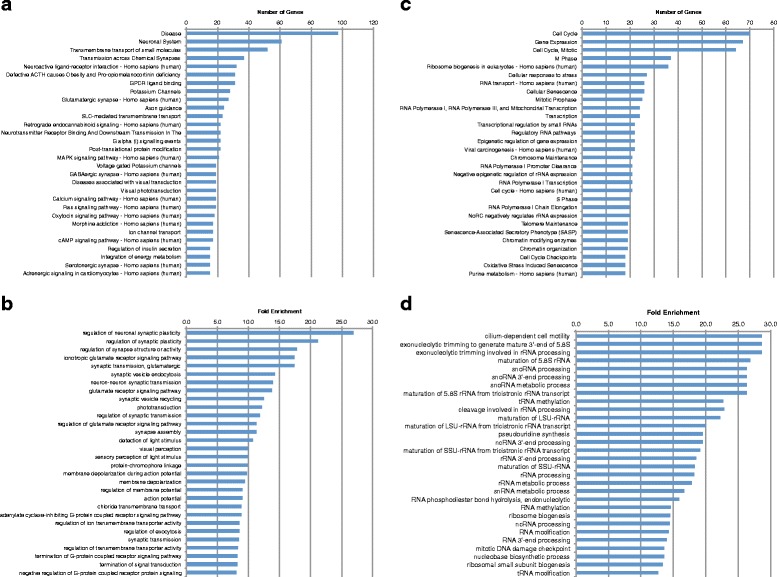
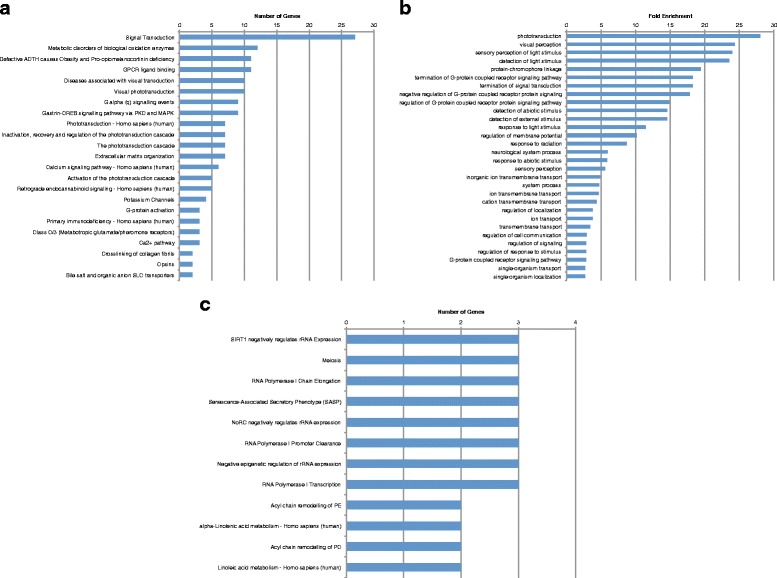
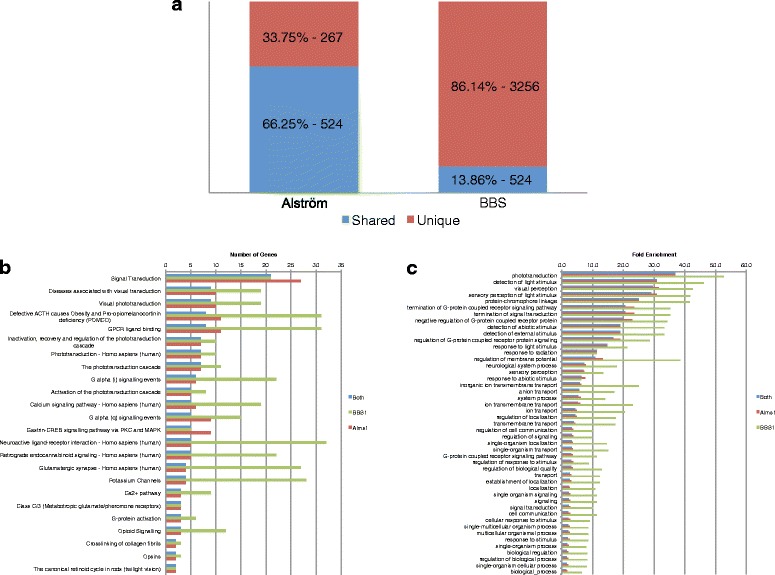
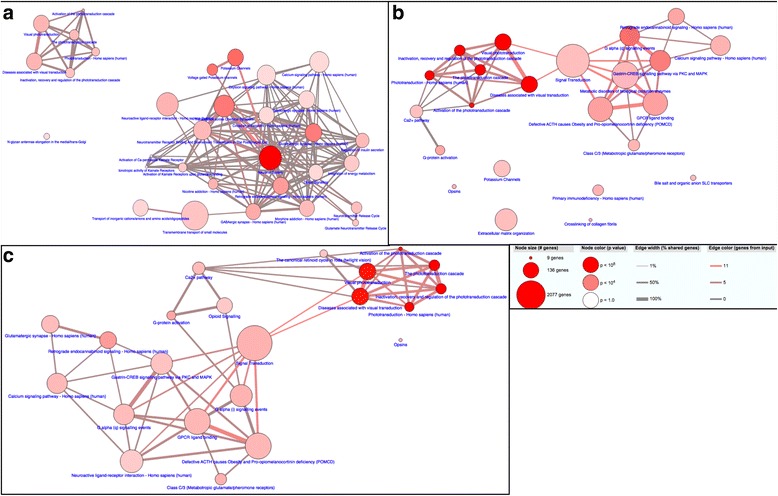
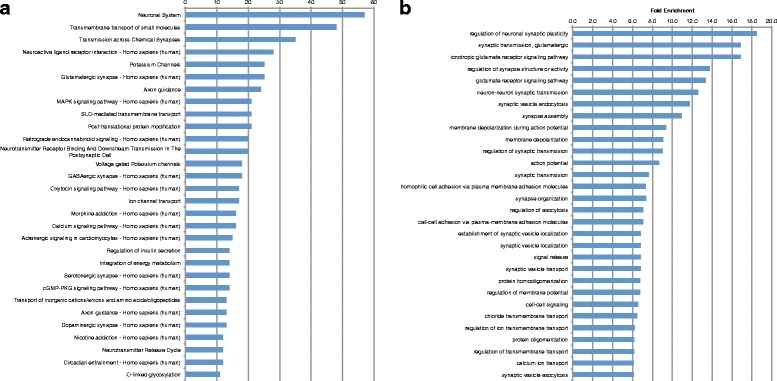
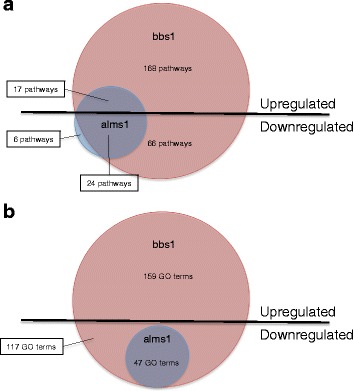
Results: We analyzed all genes that were significantly differentially expressed and found enrichment of phenotypically significant pathways in both models. These included multiple pathways shared between the two disease models as well as those unique to each model. Notably, we identified significant downregulation of genes in pathways relevant to visual system deficits and obesity in both disorders, consistent with those shared phenotypes. In contrast, neuronal pathways were significantly downregulated only in the BBS model but not in the Alström model. Our observations also suggested an important role for G-protein couple receptor and calcium signaling defects in both models.
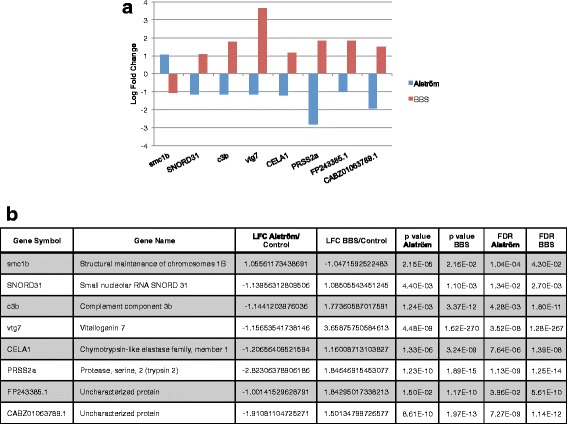
Discussion: Pathway network analyses of both models indicate that visual system defects may be driven by genetic mechanisms independent of other phenotypes whereas the majority of other phenotypes are a result of genetic players that contribute to multiple pathways simultaneously. Additionally, examination of genes differentially expressed in opposing directions between the two models suggest a deficit in pancreatic function in the Alström model, that is not present in the BBS model.
Conclusions: These findings provide important novel insight into shared and divergent phenotypes between two similar but distinct genetic syndromes.
Figures
Similar articles
-
Differential effects on β-cell mass by disruption of Bardet-Biedl syndrome or Alstrom syndrome genes.Hum Mol Genet. 2016 Jan 1;25(1):57-68. doi: 10.1093/hmg/ddv447. Epub 2015 Oct 22. Hum Mol Genet. 2016. PMID: 26494903 Free PMC article.
-
Differentiating Alström from Bardet-Biedl syndrome (BBS) using systematic ciliopathy genes sequencing.Ophthalmic Genet. 2012 Mar;33(1):18-22. doi: 10.3109/13816810.2011.620055. Epub 2011 Oct 17. Ophthalmic Genet. 2012. PMID: 22004009
-
Proteomic and Transcriptomic Landscapes of Alström and Bardet-Biedl Syndromes.Genes (Basel). 2022 Dec 15;13(12):2370. doi: 10.3390/genes13122370. Genes (Basel). 2022. PMID: 36553637 Free PMC article.
-
Alström syndrome: insights into the pathogenesis of metabolic disorders.Nat Rev Endocrinol. 2011 Feb;7(2):77-88. doi: 10.1038/nrendo.2010.210. Epub 2010 Dec 7. Nat Rev Endocrinol. 2011. PMID: 21135875 Review.
-
Bardet-Biedl syndrome: A clinical overview focusing on diagnosis, outcomes and best-practice management.Diabetes Obes Metab. 2024 Apr;26 Suppl 2:25-33. doi: 10.1111/dom.15494. Epub 2024 Feb 21. Diabetes Obes Metab. 2024. PMID: 38383825 Review.
Cited by
-
Genomic knockout of alms1 in zebrafish recapitulates Alström syndrome and provides insight into metabolic phenotypes.Hum Mol Genet. 2019 Jul 1;28(13):2212-2223. doi: 10.1093/hmg/ddz053. Hum Mol Genet. 2019. PMID: 31220269 Free PMC article.
-
Sample Preparation and Analysis of RNASeq-based Gene Expression Data from Zebrafish.J Vis Exp. 2017 Oct 27;(128):56187. doi: 10.3791/56187. J Vis Exp. 2017. PMID: 29155729 Free PMC article.
-
Exocrine pancreas proteases regulate β-cell proliferation in zebrafish ciliopathy models and in murine systems.Biol Open. 2021 Jun 15;10(6):bio046839. doi: 10.1242/bio.046839. Epub 2021 Jun 14. Biol Open. 2021. PMID: 34125181 Free PMC article.
-
Challenges for the implementation of next generation sequencing-based expanded carrier screening: Lessons learned from the ciliopathies.Eur J Hum Genet. 2023 Aug;31(8):953-961. doi: 10.1038/s41431-022-01267-8. Epub 2022 Dec 23. Eur J Hum Genet. 2023. PMID: 36550190 Free PMC article.
-
Recessive ciliopathy mutations in primary endocardial fibroelastosis: a rare neonatal cardiomyopathy in a case of Alstrom syndrome.J Mol Med (Berl). 2021 Nov;99(11):1623-1638. doi: 10.1007/s00109-021-02112-z. Epub 2021 Aug 13. J Mol Med (Berl). 2021. PMID: 34387706 Free PMC article.
References
Publication types
MeSH terms
Grants and funding
LinkOut - more resources
Full Text Sources
Other Literature Sources
Molecular Biology Databases
