

EigenGWAS: finding loci under selection through genome-wide association studies of eigenvectors in structured populations
- PMID: 27142779
- PMCID: PMC4901357
- DOI: 10.1038/hdy.2016.25
EigenGWAS: finding loci under selection through genome-wide association studies of eigenvectors in structured populations
Abstract
We develop a novel approach to identify regions of the genome underlying population genetic differentiation in any genetic data where the underlying population structure is unknown, or where the interest is assessing divergence along a gradient. By combining the statistical framework for genome-wide association studies (GWASs) with eigenvector decomposition (EigenGWAS), which is commonly used in population genetics to characterize the structure of genetic data, loci under selection can be identified without a requirement for discrete populations. We show through theory and simulation that our approach can identify regions under selection along gradients of ancestry, and in real data we confirm this by demonstrating LCT to be under selection between HapMap CEU-TSI cohorts, and we then validate this selection signal across European countries in the POPRES samples. HERC2 was also found to be differentiated between both the CEU-TSI cohort and within the POPRES sample, reflecting the likely anthropological differences in skin and hair colour between northern and southern European populations. Controlling for population stratification is of great importance in any quantitative genetic study and our approach also provides a simple, fast and accurate way of predicting principal components in independent samples. With ever increasing sample sizes across many fields, this approach is likely to be greatly utilized to gain individual-level eigenvectors avoiding the computational challenges associated with conducting singular value decomposition in large data sets. We have developed freely available software, Genetic Analysis Repository (GEAR), to facilitate the application of the methods.
Figures
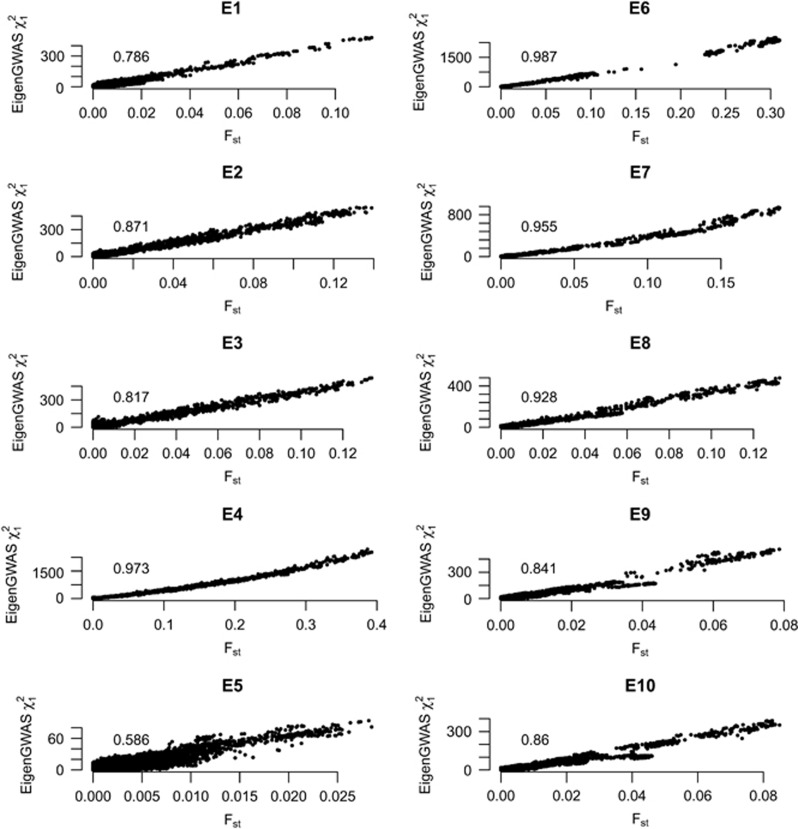
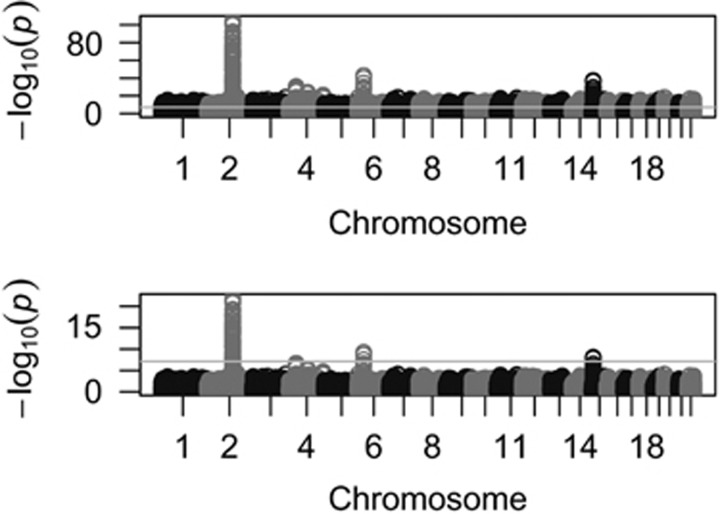
 for EigenGWAS SNP effects for POPRES. For each eigenvector, upon Ei >0 or Ei ⩽0, POPRES samples were split into two groups, upon which Fst was calculated for each locus. The correlation, at top left in each plot, was measured in R2.
Similar articles
-
Identifying outlier loci in admixed and in continuous populations using ancestral population differentiation statistics.Mol Ecol. 2016 Oct;25(20):5029-5042. doi: 10.1111/mec.13822. Epub 2016 Sep 14. Mol Ecol. 2016. PMID: 27565448
-
A method for identifying haplotypes carrying the causative allele in positive natural selection and genome-wide association studies.Bioinformatics. 2011 Mar 15;27(6):822-8. doi: 10.1093/bioinformatics/btr007. Epub 2011 Jan 6. Bioinformatics. 2011. PMID: 21216773
-
Using genome scans of DNA polymorphism to infer adaptive population divergence.Mol Ecol. 2005 Mar;14(3):671-88. doi: 10.1111/j.1365-294X.2005.02437.x. Mol Ecol. 2005. PMID: 15723660 Review.
-
Genomic consequences of selection and genome-wide association mapping in soybean.BMC Genomics. 2015 Sep 3;16(1):671. doi: 10.1186/s12864-015-1872-y. BMC Genomics. 2015. PMID: 26334313 Free PMC article.
-
The statistical properties of gene-set analysis.Nat Rev Genet. 2016 Apr 12;17(6):353-64. doi: 10.1038/nrg.2016.29. Nat Rev Genet. 2016. PMID: 27070863 Review.
Cited by
-
Genomic analysis reveals genes affecting distinct phenotypes among different Chinese and western pig breeds.Sci Rep. 2018 Sep 6;8(1):13352. doi: 10.1038/s41598-018-31802-x. Sci Rep. 2018. PMID: 30190566 Free PMC article.
-
Genome-Wide Association Study for Plant Height and Grain Yield in Rice under Contrasting Moisture Regimes.Front Plant Sci. 2016 Nov 29;7:1801. doi: 10.3389/fpls.2016.01801. eCollection 2016. Front Plant Sci. 2016. PMID: 27965699 Free PMC article.
-
The sockeye salmon genome, transcriptome, and analyses identifying population defining regions of the genome.PLoS One. 2020 Oct 29;15(10):e0240935. doi: 10.1371/journal.pone.0240935. eCollection 2020. PLoS One. 2020. PMID: 33119641 Free PMC article.
-
Whole genome variants across 57 pig breeds enable comprehensive identification of genetic signatures that underlie breed features.J Anim Sci Biotechnol. 2020 Dec 3;11(1):115. doi: 10.1186/s40104-020-00520-8. J Anim Sci Biotechnol. 2020. PMID: 33292532 Free PMC article.
-
PigBiobank: a valuable resource for understanding genetic and biological mechanisms of diverse complex traits in pigs.Nucleic Acids Res. 2024 Jan 5;52(D1):D980-D989. doi: 10.1093/nar/gkad1080. Nucleic Acids Res. 2024. PMID: 37956339 Free PMC article.
References
-
- Cavalli-Sforza LL, Menozzi P, Piazza A. (1996) The History and Geography of Human Genes. Princeton University Press.
Publication types
MeSH terms
LinkOut - more resources
Full Text Sources
Other Literature Sources
