

Cascading failures in coupled networks with both inner-dependency and inter-dependency links
- PMID: 27142883
- PMCID: PMC4855168
- DOI: 10.1038/srep25294
Cascading failures in coupled networks with both inner-dependency and inter-dependency links
Erratum in
-
Corrigendum: Cascading failures in coupled networks with both inner-dependency and inter-dependency links.Sci Rep. 2016 Oct 10;6:34431. doi: 10.1038/srep34431. Sci Rep. 2016. PMID: 27721379 Free PMC article. No abstract available.
Abstract
We study the percolation in coupled networks with both inner-dependency and inter-dependency links, where the inner- and inter-dependency links represent the dependencies between nodes in the same or different networks, respectively. We find that when most of dependency links are inner- or inter-ones, the coupled networks system is fragile and makes a discontinuous percolation transition. However, when the numbers of two types of dependency links are close to each other, the system is robust and makes a continuous percolation transition. This indicates that the high density of dependency links could not always lead to a discontinuous percolation transition as the previous studies. More interestingly, although the robustness of the system can be optimized by adjusting the ratio of the two types of dependency links, there exists a critical average degree of the networks for coupled random networks, below which the crossover of the two types of percolation transitions disappears, and the system will always demonstrate a discontinuous percolation transition. We also develop an approach to analyze this model, which is agreement with the simulation results well.
Figures

 jumps from
  to zero abruptly at the critical point
  . The lines denote the numerical solutions and the symbols denote the simulation results from 20 time realizations on networks with 105 nodes.
 , pc ≈ 0.2513 with nonzero
  and
and  . (d–f),
  , pc ≈ 0.3136 with
  and nonzero
  . (g–i),
  . pc ≈ 0.4539 with nonzero
  and
and  .
.
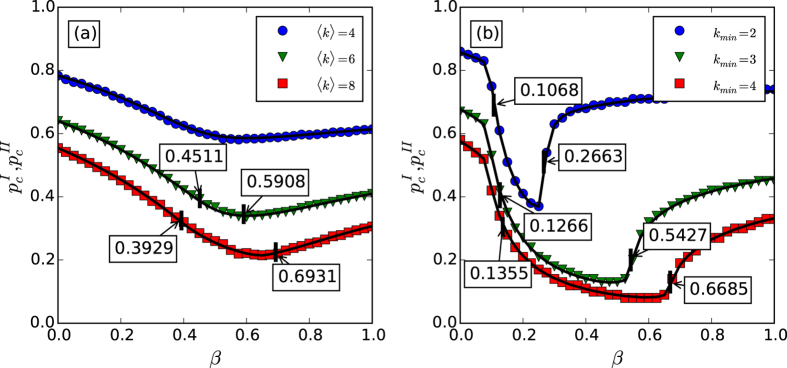
 . For 〈k〉 = 6, βc = 0.4511 and
  . For 〈k〉 = 4, the two tricritical points are merged together and the coupled networks always demonstrate discontinuous percolation transition. The theoretical prediction for the continuous percolation transition points
  are the results of eq. (13) and the discontinuous percolation transition points
  are obtained as the way shown in Fig. 2. Panel (b) shows the results for coupled scale-free networks with different lower bounds kmin and the same upper bound kmin = 316. For kmin = 2, βc = 0.1068 and
  . For kmin = 3, βc = 0.1266 and
  . For kmin = 4, βc = 0.1355 and
  . In both panels, the symbols represent simulation results from 20 time realizations on networks with 105 nodes, and the solid lines represent the theoretical predictions.
Similar articles
-
Percolation on interacting networks with feedback-dependency links.Chaos. 2015 Jan;25(1):013101. doi: 10.1063/1.4905202. Chaos. 2015. PMID: 25637912
-
Robustness of Interdependent Networks with Weak Dependency Based on Bond Percolation.Entropy (Basel). 2022 Dec 9;24(12):1801. doi: 10.3390/e24121801. Entropy (Basel). 2022. PMID: 36554206 Free PMC article.
-
Percolation Transitions in Edge-Coupled Interdependent Networks with Reinforced Inter-Layer Links.Entropy (Basel). 2024 Aug 16;26(8):693. doi: 10.3390/e26080693. Entropy (Basel). 2024. PMID: 39202163 Free PMC article.
-
Enhanced robustness of single-layer networks with redundant dependencies.Phys Rev E. 2021 Feb;103(2-1):022321. doi: 10.1103/PhysRevE.103.022321. Phys Rev E. 2021. PMID: 33736025
-
Influencer identification in dynamical complex systems.J Complex Netw. 2020 Apr;8(2):cnz029. doi: 10.1093/comnet/cnz029. Epub 2019 Aug 5. J Complex Netw. 2020. PMID: 32774857 Free PMC article. Review.
Cited by
-
The "weak" interdependence of infrastructure systems produces mixed percolation transitions in multilayer networks.Sci Rep. 2018 Feb 1;8(1):2111. doi: 10.1038/s41598-018-20019-7. Sci Rep. 2018. PMID: 29391411 Free PMC article.
References
-
- Albert R., Jeong H. & Barabási A.-L. Error and attack tolerance of complex networks. Nature 406, 378–382 (2000). - PubMed
-
- Newman M. E. J. Networks: An Introduction (Oxford University Press, Oxford, 2010).
-
- Cohen R. & Havlin S. Complex Networks: Structure, Robustness and Function (Cambridge University Press, 2010).
-
- Buldyrev S. V., Parshani R., Paul G. & Stanley H. E. Catastrophic failures in interdependent networks. Nature 464, 1025–1028 (2010). - PubMed
-
- Vespignani A. Complex networks: The fragility of interdependency. Nature 464, 984–985 (2010). - PubMed
Publication types
LinkOut - more resources
Full Text Sources
Other Literature Sources
