. 2016 May 4:6:25401.
doi: 10.1038/srep25401.

Matrix stiffness promotes cartilage endplate chondrocyte calcification in disc degeneration via miR-20a targeting ANKH expression

Affiliations

Matrix stiffness promotes cartilage endplate chondrocyte calcification in disc degeneration via miR-20a targeting ANKH expression

Ming-Han Liu et al. Sci Rep. .

Abstract

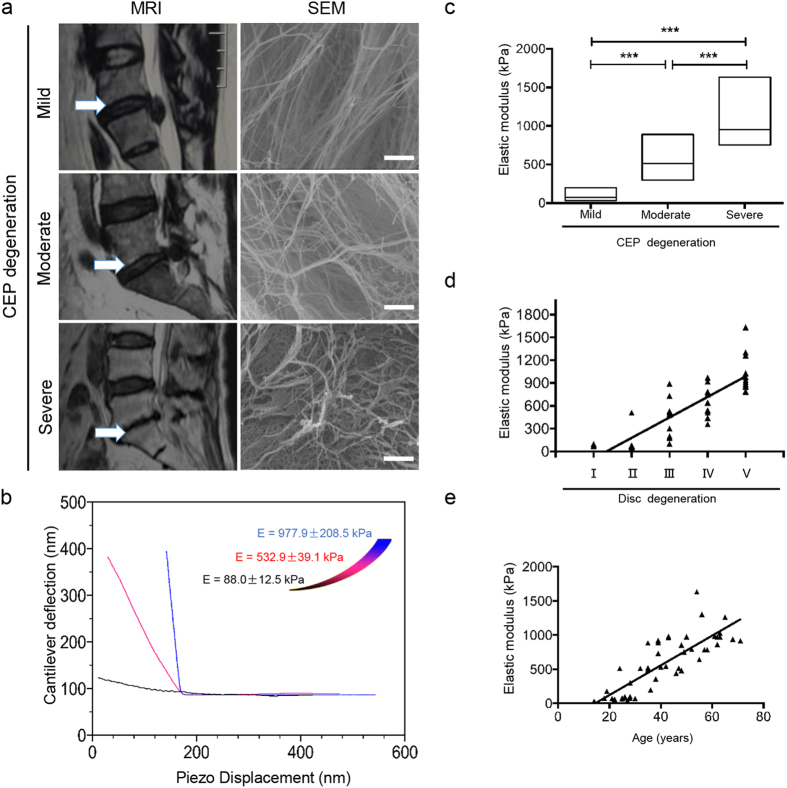
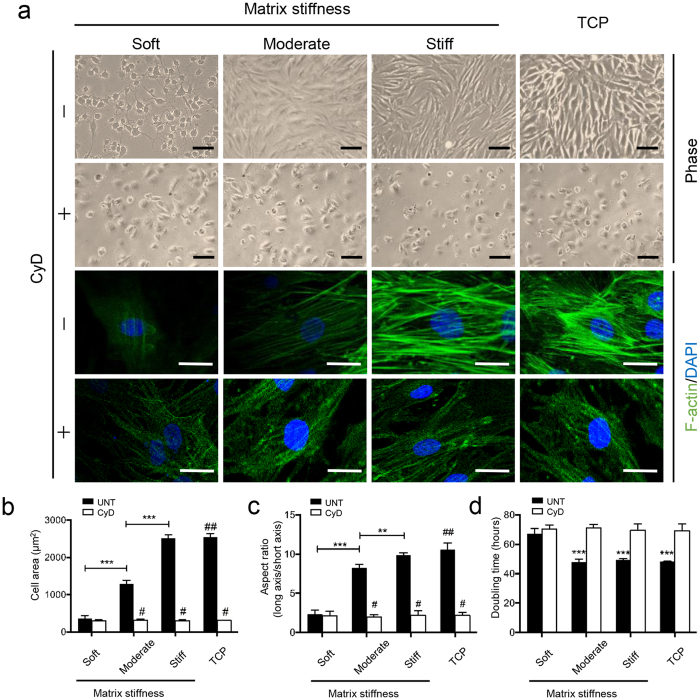
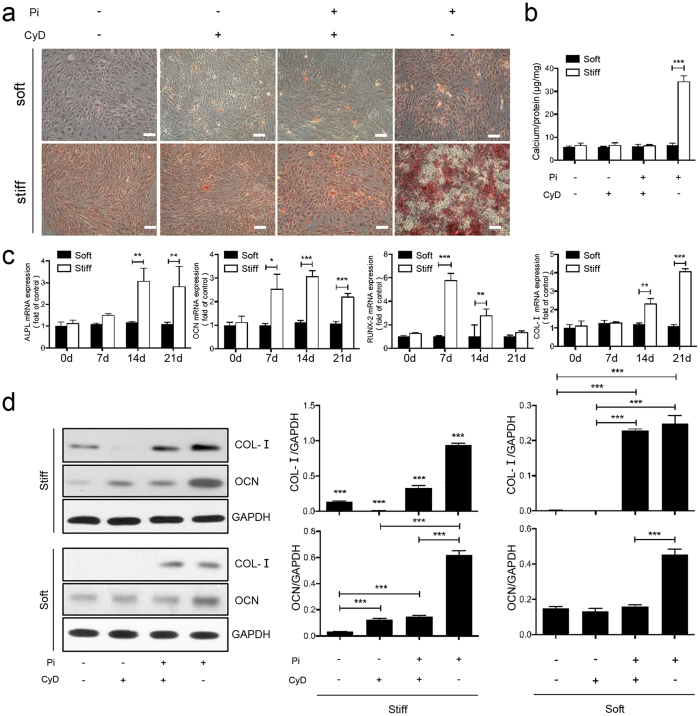
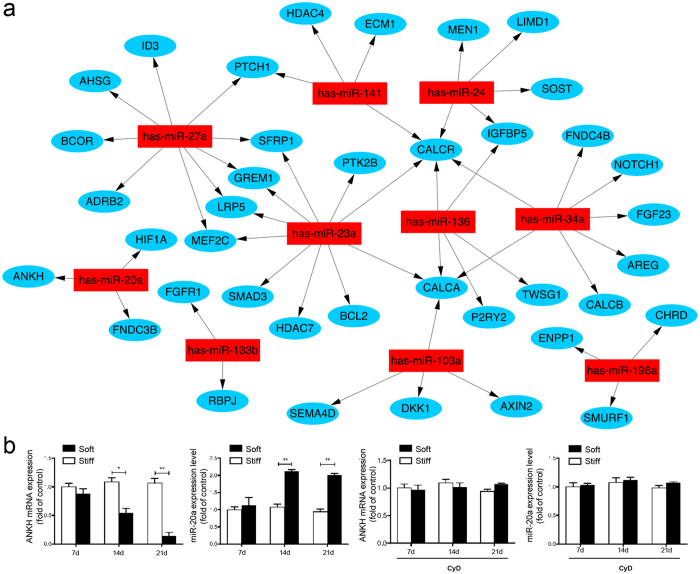
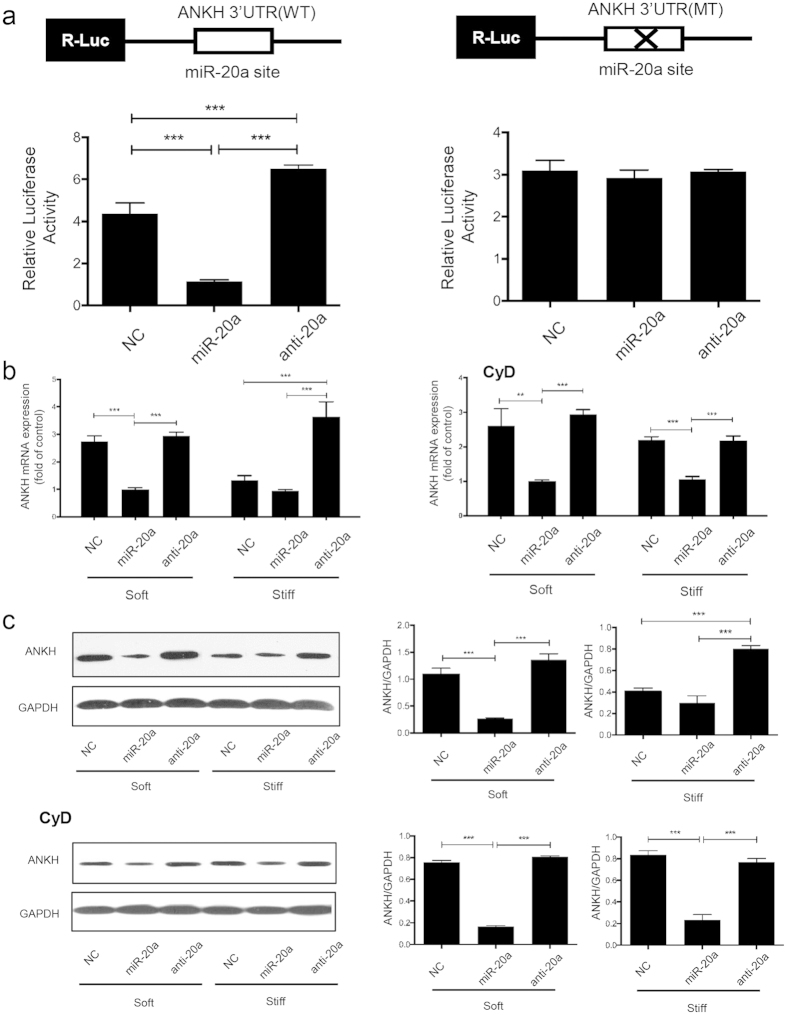
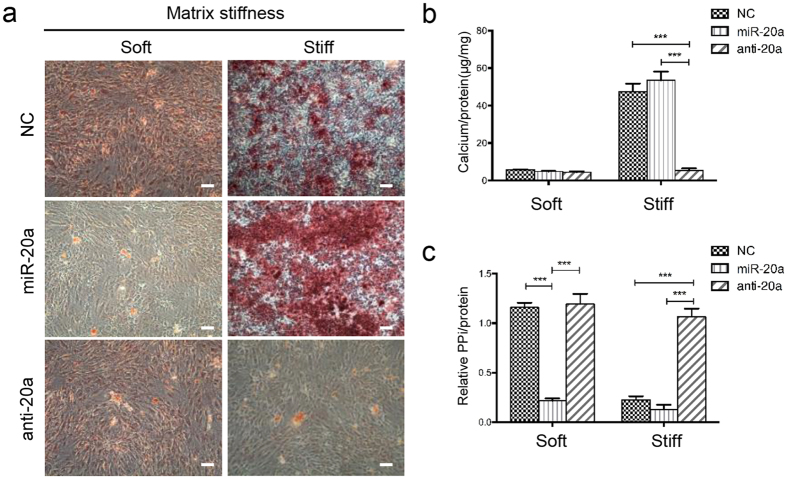
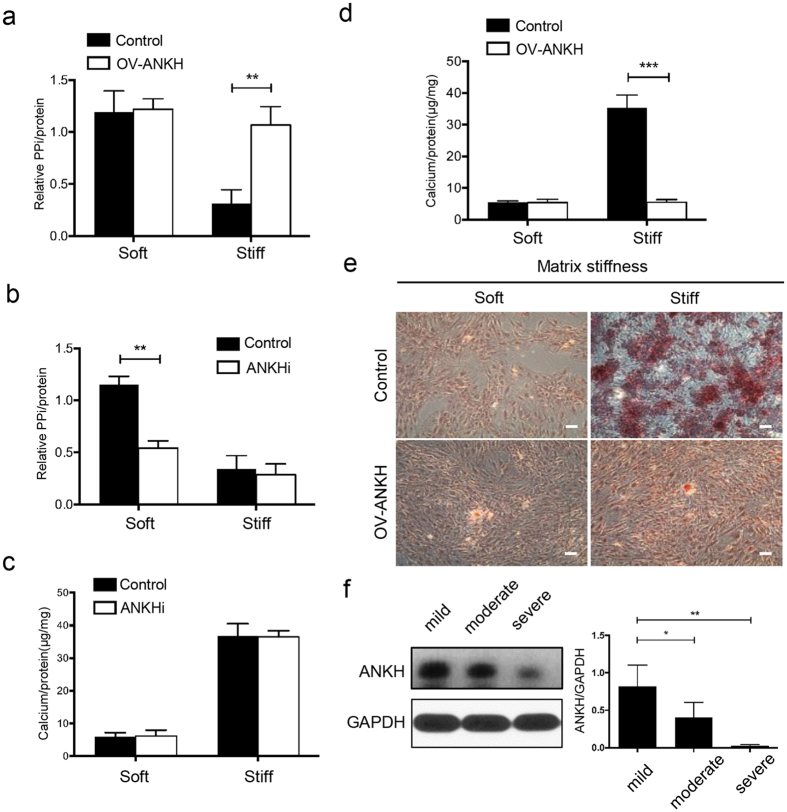
The mechanical environment is crucial for intervertebral disc degeneration (IDD). However, the mechanisms underlying the regulation of cartilage endplate (CEP) calcification by altered matrix stiffness remain unclear. In this study, we found that matrix stiffness of CEP was positively correlated with the degree of IDD, and stiff matrix, which mimicked the severe degeneration of CEP, promoted inorganic phosphate-induced calcification in CEP chondrocytes. Co-expression analysis of the miRNA and mRNA profiles showed that increasing stiffness resulted in up-regulation of miR-20a and down-regulation of decreased ankylosis protein homolog (ANKH) during inorganic phosphate-induced calcification in CEP chondrocytes. Through a dual luciferase reporter assay, we confirmed that miR-20a directly targets 3'-untranslated regions of ANKH. The inhibition of miR-20a attenuated the calcium deposition and calcification-related gene expression, whereas the overexpression of miR-20a enhanced calcification in CEP chondrocytes on stiff matrix. The rescue of ANKH expression restored the decreased pyrophosphate efflux and inhibited calcification. In clinical samples, the levels of ANKH expression were inversely associated with the degeneration degree of CEP. Thus, our findings demonstrate that the miR-20a/ANKH axis mediates the stiff matrix- promoted CEP calcification, suggesting that miR-20a and ANKH are potential targets in restraining the progression of IDD.


Figures

Figure 1
Figure 1. Degeneration of CEPs is accompanied by collagen disarrangement and increased elastic modulus.
(a) Representative magnetic resonance images (MRIs) of CEPs with mild, moderate or severe degeneration (grades 2, 4, or 6, respectively) obtained from the patients after disc fusion operations. Representative scanning electron microscopy (SEM) image of mild degeneration CEP shows normal collagen meshwork organization. Representative SEM image of moderate degeneration CEP exhibits increased collagen fibril tangles and disarrangement. Representative SEM image of severe degeneration reveals extensive splitting of the collagen meshwork. Scale bars, 0.5 μm. (b) Atomic force microscopy indentation tests of CEP samples from the patients. Three average unloading curves of CEPs with different degrees of degeneration (black, mild degeneration, E = 88.0 ± 12.5 kPa; blue, moderate degeneration, E = 532.9 ± 39.1 kPa; red, severe degeneration, E = 977.9 ± 208.5 kPa) show a significant difference in slopes calculated from the curves. (c) Elastic modulus of CEPs of different degeneration grades. On each box, the edges and the line of the box are the minimum and maximum data, and the means, respectively. The significant difference in matrix stiffness among the different degeneration degrees of CEPs is shown. (d) Correlation between CEP stiffness and the degree of IDD. (e) Correlation between CEP stiffness and ages of human patients. Scale bar = 0.5 μm. *indicates P < 0.05, and ***indicates P < 0.001 based on one-way ANOVA.
Figure 2
Figure 2. Matrix stiffness modulates the morphology, cytoskeletal organization and proliferation of CEP chondrocytes.
CEP chondrocytes were attached and viable on polyacrylamide gels with soft, moderate, or stiff matrix (E’ = 90.0 kPa, 540.0 kPa, and 950.0 kPa, respectively) and compared to those on standard tissue culture plastic (TCP) with or without the addition of cytochalasin-D (CyD) (0.25 μg/mL × 0.5 mL). (a) CEP chondrocytes displayed increased cell spreading along with increased matrix stiffness without CyD treatment. In contrast, pharmacologic inhibition of CyD abrogated stiffness-dependent differences in cell morphology. CyD induced rounding and stellated shapes of cells on all substrates. Scale bars, 100 μm (upper two rows), 50 μm (lower two rows). CEP cells areas (b) and cell aspect ratio (c) were significantly increased in groups with higher stiffness without added CyD. CyD also counteracted stiffness-dependent differences in cell areas and cell aspect ratio. CEP chondrocytes on stiff gels or TCP had the highest aspect ratio and the largest cell area, and those on soft gels had the lowest aspect ratio and the smallest cell area without CyD treatment. UNT, the untreated group. CyD, the group with CyD treatment. #P < 0.001 with respect to the same matrix without added CyD. ##P < 0.001 with respect to soft and moderate substrates without added CyD. (d) Doubling time of groups with or without added CyD. ***indicates P < 0.001 compared to all other groups. The data are expressed as the means ± SD based on one-way ANOVA.
Figure 3
Figure 3. Matrix stiffness accelerates Pi-induced calcification and regulates the expression of calcification-related genes in CEP chondrocytes.
(a) Observation of calcium deposition in CEP chondrocytes stained by Alizarin red after treatment with or without inorganic phosphate (Pi; 3.0 mmol/L) for 14 days. Scale bars, 100 μm. (b) The calcium content assays. (c) Reverse transcription (RT)-PCR analysis for the expression of ALP, OCN, RUNX2 and COL-I. The groups on stiff matrix added with Pi showed significantly increased expression of these genes at different time points, compared with the soft group. (d) Western blotting shows high COL-I and OCN protein expression on stiff matrix with added Pi. The data are expressed as the means ± SD. *indicates P < 0.05, **indicates P < 0.01, and ***indicates P < 0.001 based on one-way ANOVA.
Figure 4
Figure 4. Increasing stiffness leads to up-regulation of miR-20a and down-regulation of ANKH in CEP chondrocytes.
(a) Bioinformatics analysis based on miRNA and mRNA chips shows a potentially targeting relationship between the most changed miRNA (red) and mRNA (blue) based on miRanda (http://www.microrna.org/) and TargetScan release 6.2 (http://targetscan.org/). (b) Validation and quantification of miRNA and mRNA changes using quantitative reverse transcription (RT)-PCR analysis shows significantly reduced ANKH and increased miR-20a in CEP chondrocytes on stiff matrix as compared with the chondrocytes on soft matrix at all days, but there was no significant difference in cells treated with CyD. The level of mRNA and miRNA expression was normalized to GAPDH and U6, respectively and graphed relative to the group cultured on soft matrix. The data are expressed as the means ± SD. *indicates P < 0.05, **indicates P < 0.01, and ***indicates P < 0.001 based on Student’s t-test.
Figure 5
Figure 5. miR-20a down-regulates ANKH expression by directly targets the 3′UTR of ANKH mRNA.
(a) Dual luciferase assay of the wild-type (WT) group (left panel). Overexpression of miR-20a significantly reduced the relative luciferase activity. Dual luciferase assay of the mutant (MT) group (right panel). No significant differences were observed among the three groups. (b) ANKH mRNA expression for CEP chondrocytes cultured on soft or stiff matrix with or without the addition of 0.25 μg/mL CyD for 14 days. The results are normalized to GFPDH and graphed relative to soft matrix. (c) Representative western blot images of CEP chondrocytes on soft or stiff matrix with or without the addition of 0.25 μg/mL CyD for 14 days. CyD represents the group with CyD treatment. The data are expressed the means ± SD. *P < 0.05, **P < 0.01, and ***P < 0.001 based on one-way ANOVA.
Figure 6
Figure 6. Silencing of miR-20a inhibits calcification in CEP chondrocytes on stiff matrix.
(a) Representative images of Alizarin red staining of CEP chondrocytes transfected with a negative control (NC), miR-20a, anti-miR-20a using Lipofectamine 2000 and the chondrocytes treated with inorganic phosphate (Pi; 3.0 mmol/L) for 7 days. Scale bars, 100 μm. (b) The calcium content assays of the CEP chondrocytes cultured on soft or stiff matrix transfected with NC, miR-20a, or anti-miR-20a. (c) PPi levels in the medium of the chondrocytes cultured on soft or stiff matrix transfected with NC, miR-20a, or anti-miR-20a were measured. The data are expressed as the means ± SD. ***indicates P < 0.001 based on one-way ANOVA.
Figure 7
Figure 7. ANKH regulates calcification in CEP chondrocytes on stiff matrix and is decreased in human degenerative CEP tissues.
(a) PPi levels in the medium of the CEP chondrocytes containing empty vector (Control) or ANKH expression vector (OV ANKH) were measured. (b) PPi levels in the medium of the CEP chondrocytes containing empty vector (Control) or ANKH inhibitor (ANKHi, probenecid, 2 mmol/L) cultured on soft or stiff matrix for 14 days were measured. (c,d) Calcium content assay of the groups treated with OV-ANKH or ANKHi. (e) Alizarin red staining showed the protective effect of ANKH overexpression on calcification induced by inorganic phosphate (Pi, 3.0 mmol/L) for 14 days on soft or stiff matrix. Scale bars, 100 μm. (f) Representative western blot images of ANKH in human CEP samples obtained from patients undergoing disc fusion operations. The expression level of ANKH decreased along with the degenerative degrees of human CEP. The data are expressed as the means ± SD. *indicates P < 0.05, **indicates P < 0.01, and ***indicates P < 0.001 based on one-way ANOVA.

Similar articles

Cited by

References

    1. Borenstein D. G. Epidemiology, etiology, diagnostic evaluation, and treatment of low back pain. Current opinion in rheumatology 13, 128–134 (2001). - PubMed
    1. Kelsey J. L. & White A. A. 3rd. Epidemiology and impact of low-back pain. Spine (Phila Pa 1976) 5, 133–142 (1980). - PubMed
    1. Riihimaki H. Low-back pain, its origin and risk indicators. Scand J Work Environ Health 17, 81–90 (1991). - PubMed
    1. Urban J. P., Smith S. & Fairbank J. C. Nutrition of the intervertebral disc. Spine (Phila. Pa 1976) 29, 2700–2709 (2004). - PubMed
    1. Moore R. J. The vertebral endplate: disc degeneration, disc regeneration. Eur Spine J 15 Suppl 3, S333–337 (2006). - PMC - PubMed

Publication types

MeSH terms

LinkOut - more resources