. 2016 May 4:6:25187.
doi: 10.1038/srep25187.

Characterization of primary human hepatocyte spheroids as a model system for drug-induced liver injury, liver function and disease

Affiliations

Characterization of primary human hepatocyte spheroids as a model system for drug-induced liver injury, liver function and disease

Catherine C Bell et al. Sci Rep. .

Abstract

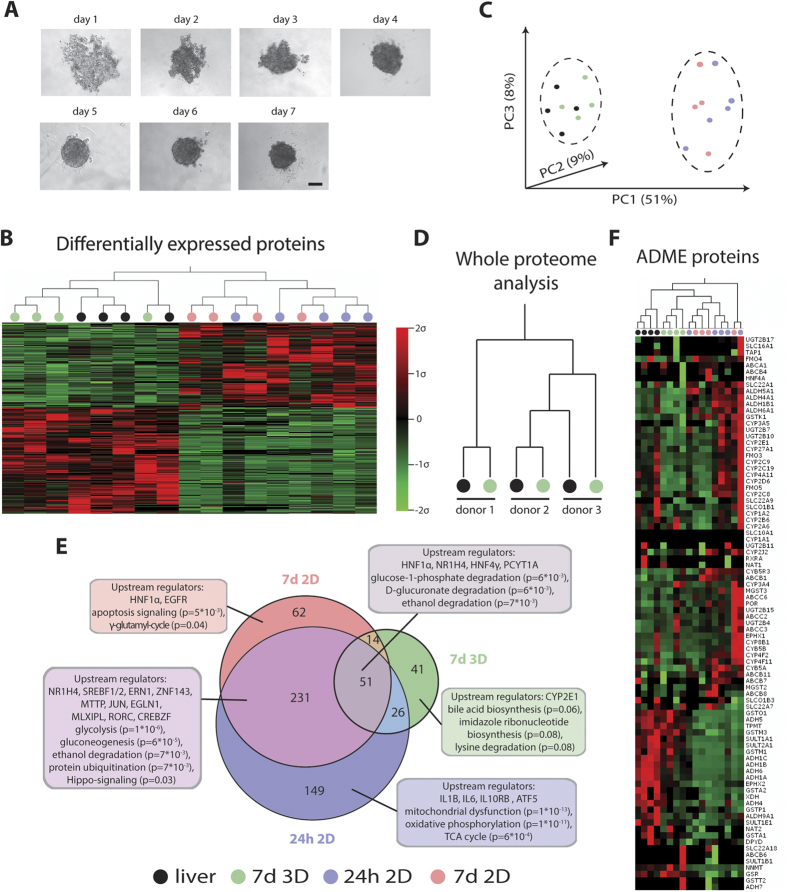
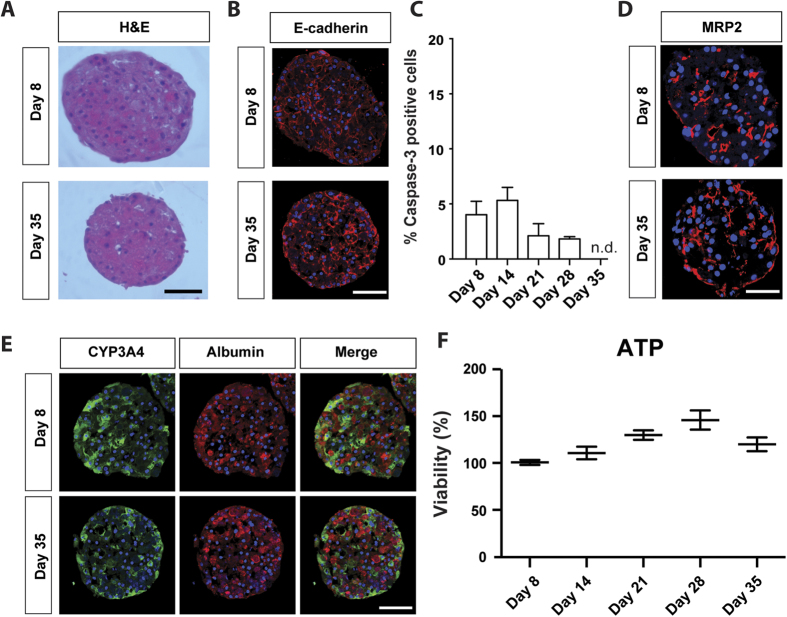
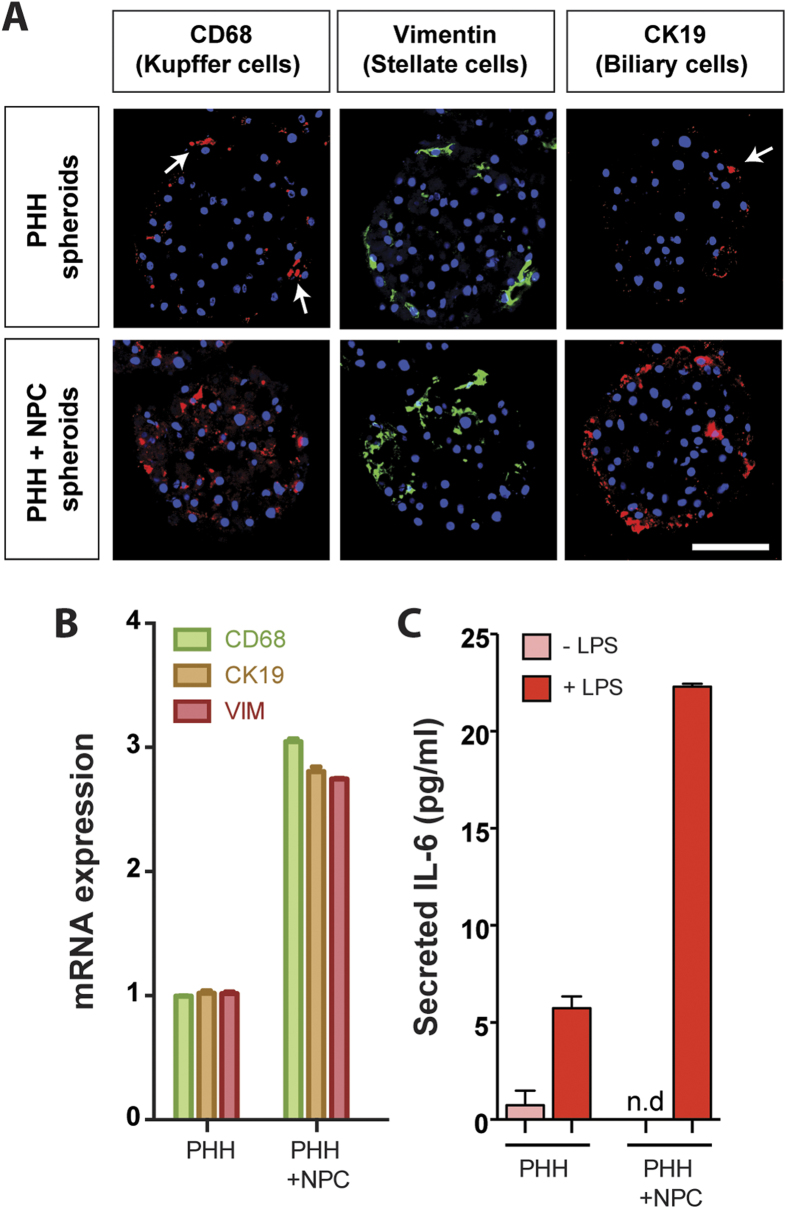
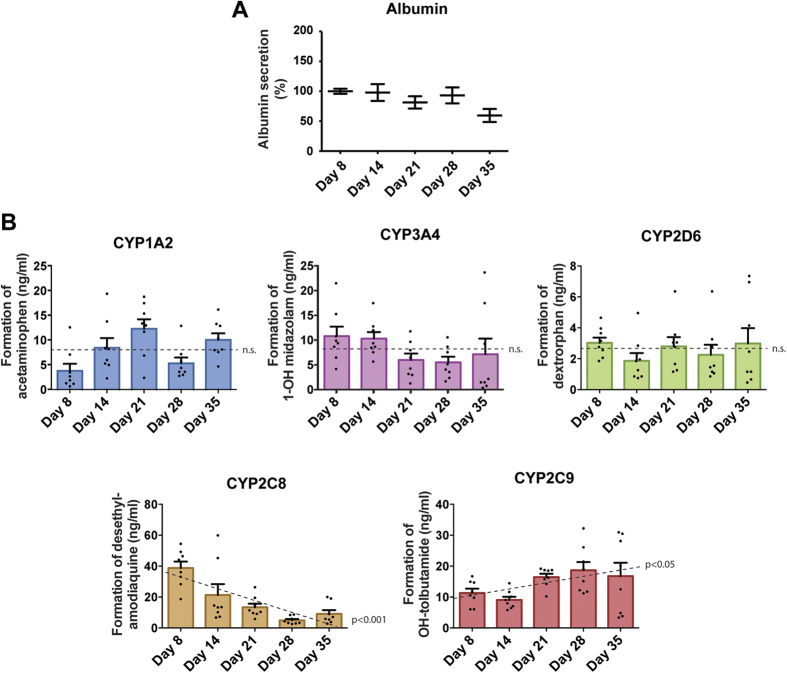
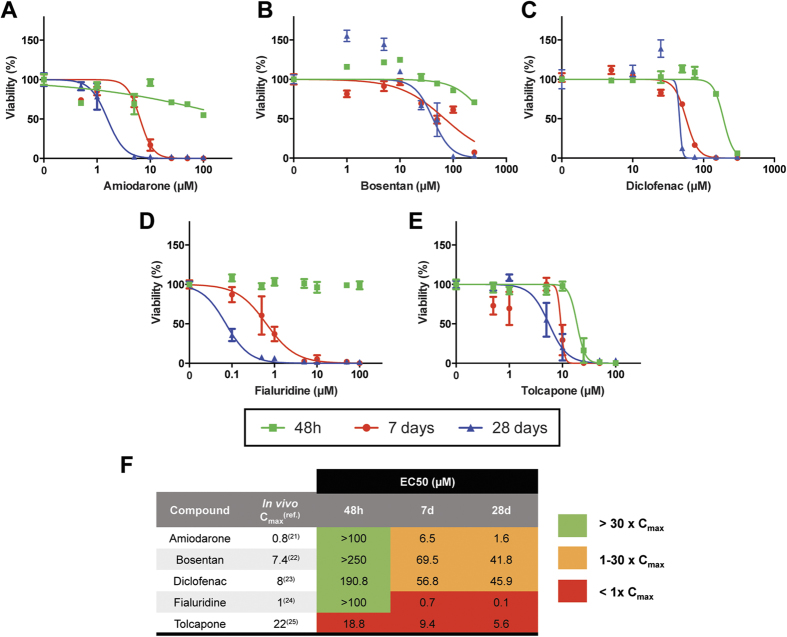
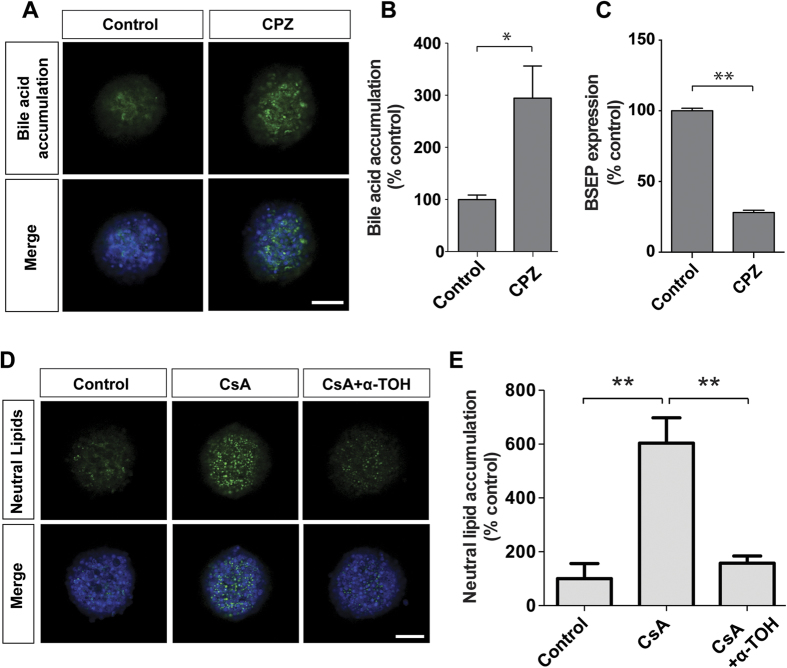
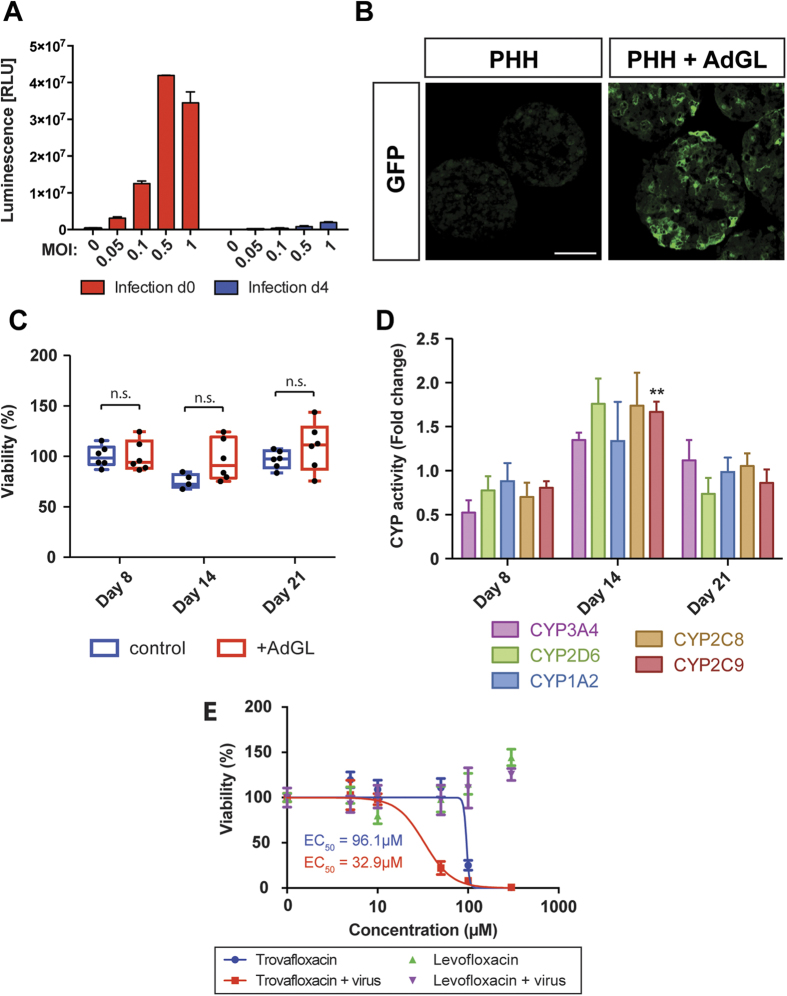
Liver biology and function, drug-induced liver injury (DILI) and liver diseases are difficult to study using current in vitro models such as primary human hepatocyte (PHH) monolayer cultures, as their rapid de-differentiation restricts their usefulness substantially. Thus, we have developed and extensively characterized an easily scalable 3D PHH spheroid system in chemically-defined, serum-free conditions. Using whole proteome analyses, we found that PHH spheroids cultured this way were similar to the liver in vivo and even retained their inter-individual variability. Furthermore, PHH spheroids remained phenotypically stable and retained morphology, viability, and hepatocyte-specific functions for culture periods of at least 5 weeks. We show that under chronic exposure, the sensitivity of the hepatocytes drastically increased and toxicity of a set of hepatotoxins was detected at clinically relevant concentrations. An interesting example was the chronic toxicity of fialuridine for which hepatotoxicity was mimicked after repeated-dosing in the PHH spheroid model, not possible to detect using previous in vitro systems. Additionally, we provide proof-of-principle that PHH spheroids can reflect liver pathologies such as cholestasis, steatosis and viral hepatitis. Combined, our results demonstrate that the PHH spheroid system presented here constitutes a versatile and promising in vitro system to study liver function, liver diseases, drug targets and long-term DILI.


Figures

Figure 1
Figure 1. 3D spheroids from PHH closely resemble the in vivo liver at the proteome level.
(A) Time series showing progressing spheroid aggregation over time. Spheroid formation was judged complete after 7 d when a well-defined perimeter could be observed. Scale bar = 100 μm. (B) Heatmap visualizing whole proteome analysis of primary human liver samples (n = 5) after 24 h and 7 d in 2D monolayer culture and spheroids after aggregation (7 d 3D). Only differentially expressed proteins (n = 574 proteins, p < 0.05, F-test) are shown. Note that in vivo liver samples (black) and spheroids (green) cluster closely together while the proteomes of samples cultured in 2D (24 h = blue; 7 d = red) are distinctly different. (C) Principle component analysis separates proteomes from liver and PHH spheroids from 2D monolayer-cultured samples. (D) In vivo phenotypes are preserved in 3D culture, with each of the 3D samples clustering with the respective liver piece from the same donor. (E) Venn diagram showing differentially regulated pathways after 24 h 2D, 7 d 2D and 7 d 3D as suggested by GSEA. Numbers in circles indicate numbers of differentially expressed genes compared to liver with p < 0.05. Extensive misregulation of a variety of important metabolic and signaling pathways is observed in 2D such as glycolysis, gluconeogenesis, Hippo-signaling and apoptosis. In contrast, the proteomes of 3D PHH spheroid cultures closely resemble in vivo livers. Indicated p-values are after Benjamini-Hochberg multiple testing correction. (F) Heatmap showing all proteins involved in absorption, distribution, metabolism and excretion (ADME) of compounds that we detected in our dataset. Note that livers and PHH spheroids cultures cluster together, similar to when whole proteomes are considered.
Figure 2
Figure 2. PHH spheroids can be maintained for at least 5 weeks in serum-free conditions.
(A) H&E staining of PHH spheroids. Note that spheroid sizes decreased coinciding with increased expression of E-cadherin (B), which has been previously shown to promote spheroid compaction. (C) Levels of cleaved caspase-3, a marker for apoptosis, remained at low levels throughout the culture period as determined by immunohistochemistry. (D) MRP2 immunostaining revealed bile canaliculi at early as well as late stages of spheroid culture. (E) Staining for the perivenous marker CYP3A4 and the periportal marker albumin reveals that the zonation-identity of liver cells is maintained. (F) Cellular ATP levels remained constant throughout 5 weeks of culture (n = 20 spheroids from 3 donors per time point). Absolute ATP values were normalized to spheroid volume to compensate for compaction. All scale bars = 100 μm.
Figure 3
Figure 3. PHH spheroids can be successfully co-cultured with non-parenchymal Kupffer, stellate and biliary cells.
Immunofluorescent stainings (A) as well as qPCR analyses (B) reveal the presence of Kupffer cells (CD68), stellate cells (vimentin) and biliary cells (CK19) in co-cultured spheroids at day 8 (bottom row). Note that some PHH preparations can already contain low numbers of NPCs (top row). (C) Co-cultured Kupffer cells were responsive to LPS-mediated activation as evidenced by elevated IL-6 secretion.
Figure 4
Figure 4. PHH cultured as spheroids remain metabolically active for at least 5 weeks in culture.
(A) Albumin secretion normalized to spheroid volumes during long-term spheroid culture (n = 15 spheroids from 3 donors per time point). (B) CYP-dependent metabolic activity of PHH spheroids over 35 days. PHH spheroids were exposed to a cocktail of 5 CYP substrates and the resulting metabolites were analysed via LC-MS/MS (n = 8 spheroids per time point). No changes in rate of drug metabolism were detected for CYP1A2, CYP2D6 and CYP3A4 over the course of 5 weeks (n.s. corresponds to p > 0.05, F-test), whereas CYP2C8 and CYP2C9 activities were found to be significantly decreased (p < 0.001) or increased (p < 0.05) respectively.
Figure 5
Figure 5. PHH spheroids support chronic toxicity assays.
PHH spheroids were treated with amiodarone (A) bosentan (B) diclofenac (C) fialuridine (D) or tolcapone (E) every second day and viability was determined at 48 h, 8 days and 28 days by measuring cellular ATP content (n = 5–6 spheroids per concentration and time point). (F) Notably, EC50 values for all compounds decreased following long-term treatment (Fold changes in EC50 vs. 48 h: for amiodarone: 15.4-fold (8 d) and 62.5-fold (28 d); for bosentan: 3.6-fold (8 d) and 6.0-fold (28 d); for diclofenac: 3.4-fold (8 d) and 4.2-fold (28 d); for fialuridine: 142.9-fold (8 d) and 1000-fold (28 d); for tolcapone: 2-fold (8 d) and 3.4-fold (28 d)). Safety margins were calculated in order to relate the observed EC50 values to the physiological plasma Cmax values observed in vivo.
Figure 6
Figure 6. PHH spheroids as a model for cholestatic and steatotic disease.
(A–C) Treatment with the cholestatic drug chlorpromazine (CPZ, 5 μM) caused significant accumulation (n = 3, p = 0.03) of the fluorescently-labelled bile acid derivative tauro-nor-THCA-25-DBD, which was associated with down-regulation of BSEP mRNA (C). (D,E) Cyclosporine A (CsA, 30 μM), a known inducer of steatosis in vivo increased levels of neutral lipids (n = 3, p = 0.003). Strikingly, cells were fully protected by co-exposure with the anti-oxidant α-tocopherol (α-TOH, 10 μM) (n = 3, p = 0.009). Bile acid and lipid accumulation were quantified and normalized to spheroid size using CellProfiler software. All scale bars = 100 μm. *indicates p < 0.05, **indicates p < 0.01.
Figure 7
Figure 7. PHH spheroids form efficiently from virus infected hepatocytes.
(A) Infection of PHH with recombinant adenovirus expressing GFP and luciferase (AdGL) was most effective if performed upon seeding (red columns; d 0) rather than when cells had aggregated into spheroids (blue columns; d 4), presumably due to the compactness of the spheroid at day 4 which hampers efficient penetration of the virus. All further experiments were performed using MOI of 0.1 due to reduced viability at higher MOIs. (B) GFP expression was observed throughout the spheroid. Scale bar = 100 μm. (C) Cell viability as determined by ATP measurements in virus-infected spheroids was not affected at MOI = 0.1. (p > 0.05 for all time points analyzed). (D) Enzyme activities of 5 key CYP enzymes (n = 8 spheroids per time point). Only CYP2C9 activity after 14 d differed significantly (Benjamini-Hochberg correction, FDR = 0.1) compared to uninfected spheroids (compare Fig. 3). (E) Viral infection sensitized cells to trovafloxacin hepatotoxicity while the non-hepatotoxic analogue levofloxacin showed no toxicity. **indicates p < 0.01, n.s. indicates p > 0.05.

References

    1. Gómez-Lechón M. J., Tolosa L., Conde I. & Donato M. T. Competency of different cell models to predict human hepatotoxic drugs. Expert Opin. Drug Metab. Toxicol. 10, 1553–1568, 10.1517/17425255.2014.967680 (2014). - DOI - PubMed
    1. Hewitt N. J. et al. Primary Hepatocytes: Current Understanding of the Regulation of Metabolic Enzymes and Transporter Proteins, and Pharmaceutical Practice for the Use of Hepatocytes in Metabolism, Enzyme Induction, Transporter, Clearance, and Hepatotoxicity Studies. Drug Metab. Rev. 39, 159–234, 10.1080/03602530601093489 (2015). - DOI - PubMed
    1. Rowe C. et al. Proteome-wide analyses of human hepatocytes during differentiation and dedifferentiation. Hepatology 58, 799–809, 10.1002/hep.26414 (2013). - DOI - PMC - PubMed
    1. Elaut G. et al. Molecular mechanisms underlying the dedifferentiation process of isolated hepatocytes and their cultures. Curr. Drug Metab. 7, 629–660 (2006). - PubMed
    1. Lin R.-Z., Chou L.-F., Chien C.-C. M. & Chang H.-Y. Dynamic analysis of hepatoma spheroid formation: roles of E-cadherin and β1-integrin. Cell Tissue Res. 324, 411–422, 10.1007/s00441-005-0148-2 (2006). - DOI - PubMed

Publication types

MeSH terms