. 2016 Jun 24;291(26):13809-22.
doi: 10.1074/jbc.M116.729483. Epub 2016 May 3.

Protein Scaffolds Control Localized Protein Kinase Cζ Activity

Affiliations

Protein Scaffolds Control Localized Protein Kinase Cζ Activity

Irene S Tobias et al. J Biol Chem. .

Abstract

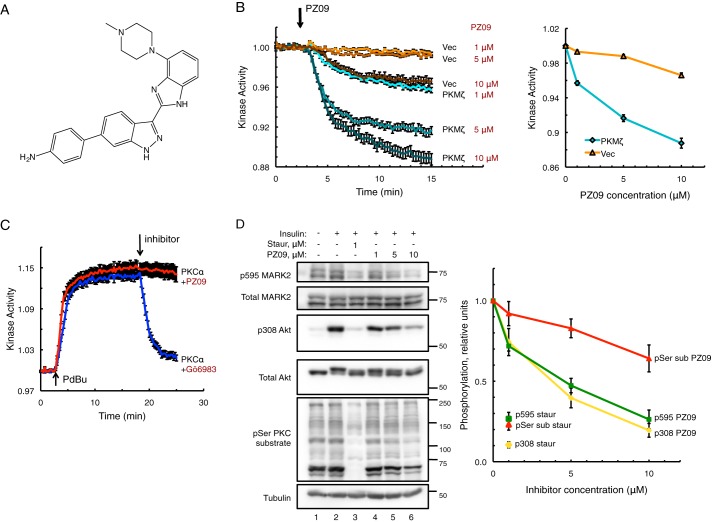
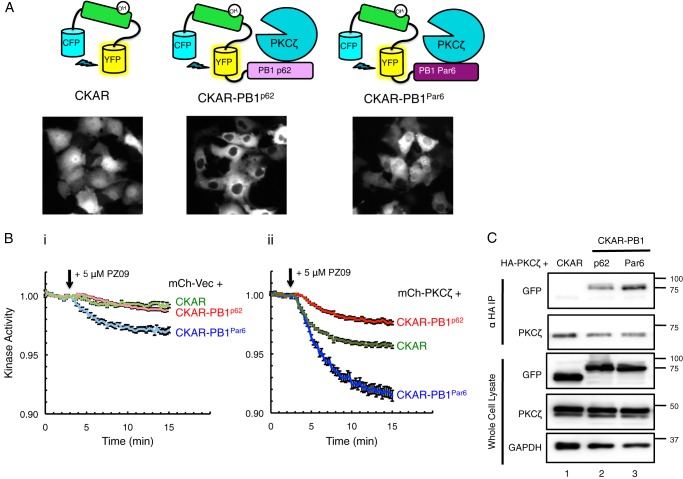
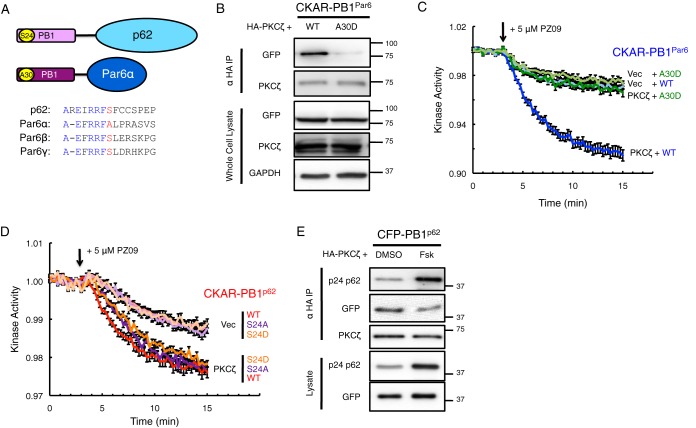
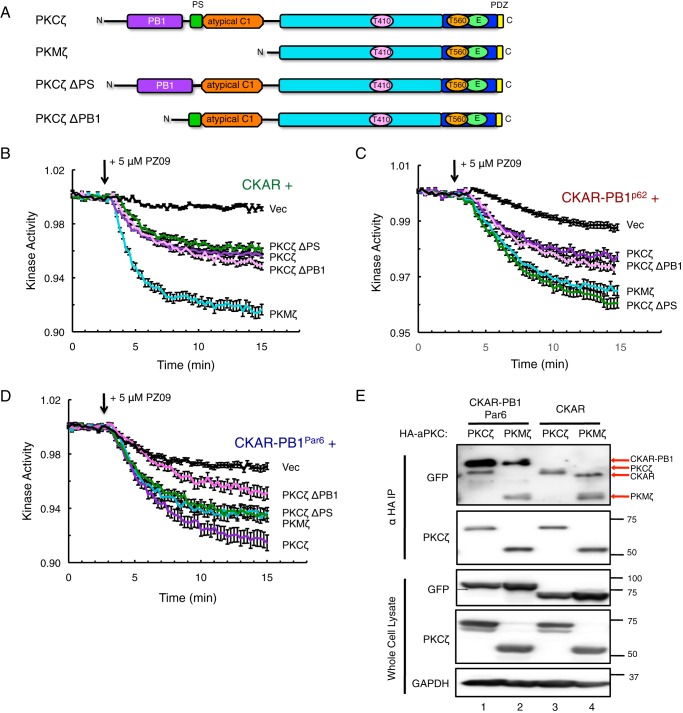
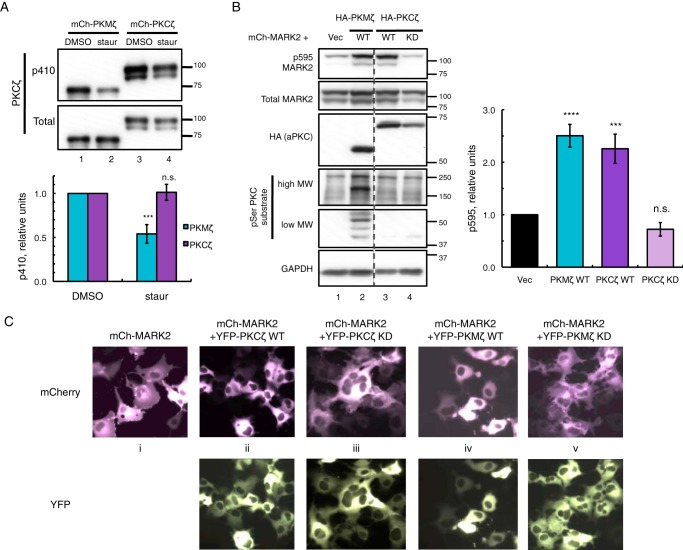
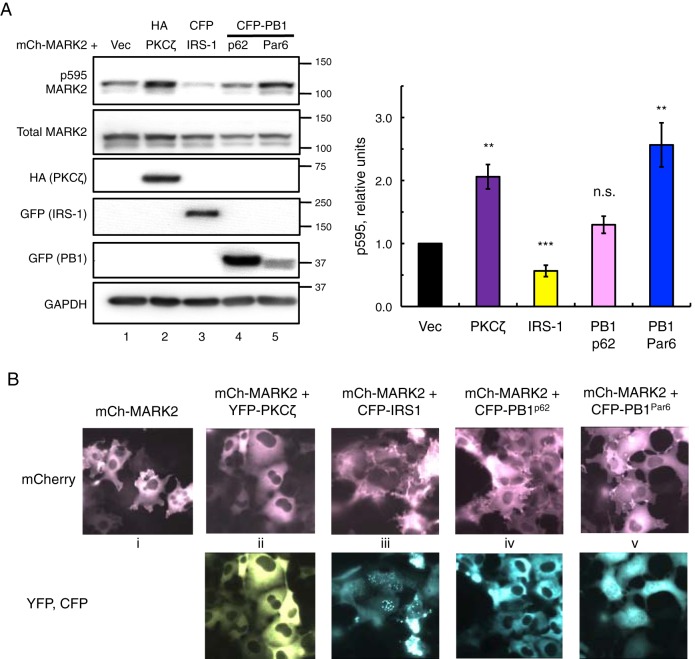
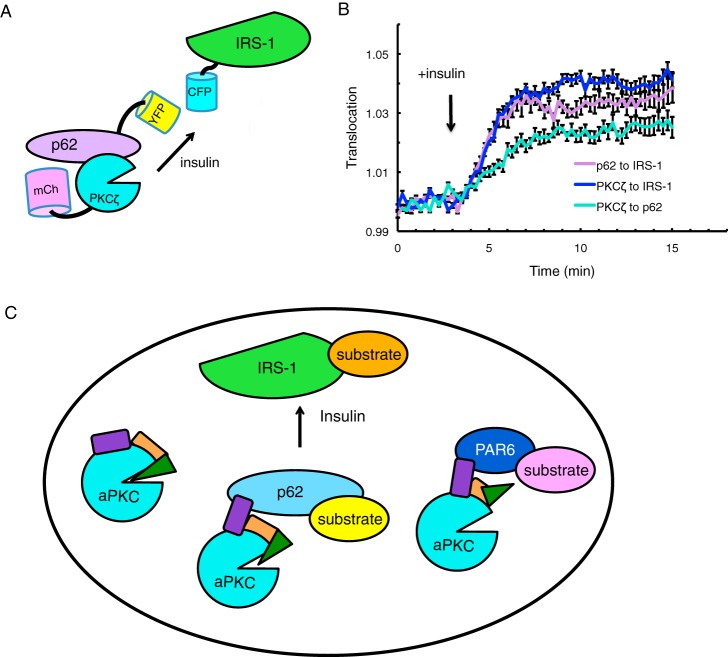
Atypical protein kinase C (aPKC) isozymes modulate insulin signaling and cell polarity, but how their activity is controlled in cells is not well understood. These enzymes are constitutively phosphorylated, insensitive to second messengers, and have relatively low activity. Here we show that protein scaffolds not only localize but also differentially control the catalytic activity of the aPKC PKCζ, thus promoting activity toward localized substrates and restricting activity toward global substrates. Using cellular substrate readouts and scaffolded activity reporters in live cell imaging, we show that PKCζ has highly localized and differentially controlled activity on the scaffolds p62 and Par6. Both scaffolds tether aPKC in an active conformation as assessed through pharmacological inhibition of basal activity, monitored using a genetically encoded reporter for PKC activity. However, binding to Par6 is of higher affinity and is more effective in locking PKCζ in an active conformation. FRET-based translocation assays reveal that insulin promotes the association of both p62 and aPKC with the insulin-regulated scaffold IRS-1. Using the aPKC substrate MARK2 as another readout for activity, we show that overexpression of IRS-1 reduces the phosphorylation of MARK2 and enhances its plasma membrane localization, indicating sequestration of aPKC by IRS-1 away from MARK2. These results are consistent with scaffolds serving as allosteric activators of aPKCs, tethering them in an active conformation near specific substrates. Thus, signaling of these intrinsically low activity kinases is kept at a minimum in the absence of scaffolding interactions, which position the enzymes for stoichiometric phosphorylation of substrates co-localized on the same protein scaffold.

Keywords: MARK2; Par6; autoinhibition; insulin; insulin receptor substrate 1 (IRS-1); p62 (sequestosome 1(SQSTM1)); protein kinase C (PKC); scaffold protein.


Figures

FIGURE 1.
FIGURE 1.
PZ09 inhibits atypical PKCs but not conventional PKCs in cells. A, chemical structure of PZ09. B, basal kinase activity measured via changes in CFP over FRET ratio using PKC-specific substrate reporter CKAR and mCherry-tagged PKMζ versus mCherry-Vec control in live COS-7 cells treated with increasing concentrations of aPKC inhibitor PZ09. The trace for each cell imaged was normalized to its t = 0-min baseline value and plotted as means ± S.E. Normalized FRET ratios were combined from three independent experiments (all PKMζ traces and Vec 1 μm and 10 μm traces) or five independent experiments for Vec 5 μm, with each experiment analyzing 6–12 selected cells. Inhibitory response curve is plotted as amplitude of drop from baseline activity at 15-min time point versus PZ09 concentration. C, stimulated kinase activity on CKAR of mCherry-PKCα after treatment with 200 nm phorbol dibutyrate (PDBu) followed by treatment with either cPKC/novel PKC-specific inhibitor Gö6983 (250 nm) or PZ09 (5 μm). The trace for each cell imaged was normalized to its t = 0-min baseline value, and normalized FRET ratios were combined from three independent experiments with analysis of 8–12 selected cells each and plotted as mean ± S.E. D, COS-7 cells were serum-starved overnight and treated with either DMSO, staurosporine (Staur) (1 μm), or increasing concentrations of PZ09 for 30 min prior to stimulation with 100 nm insulin for 10 min before lysis. Immunoblots show endogenous substrate phosphorylation representing aPKC inhibition (p595 MARK2), PDK1 inhibition (insulin-stimulated p308 Akt), and cPKC inhibition (pSer sub, using an antibody for a PKC-specific serine substrate sequence). Quantification of phosphorylated protein substrate over total protein normalized to DMSO + insulin control using n = 5 separate experiments plotted as mean ± S.E. versus inhibitor concentration (PZ09 or staurosporine) is shown. Phosphorylated PKC serine substrate was quantified as the intensity of the total band ensemble detected between 50 and 250 kDa divided by tubulin signal and normalized to DMSO + insulin control.
FIGURE 2.
FIGURE 2.
PKCζ is constitutively active on CKAR substrate reporter tethered to interacting PB1 domains of scaffold proteins p62 and Par6. A, diagram of reporters constructed to measure aPKC activity: CKAR, CKAR-PB1p62, and CKAR-PB1Par6, with corresponding images of COS-7 cells transfected with each reporter showing its localization. B, basal kinase activity of mCherry-Vec (mCh-Vec) (panel i) and mCh-PKCζ (panel ii) on each reporter shown in A after treatment with 5 μm PZ09 in live COS-7 cells. The trace for each cell imaged was normalized to its t = 0-min baseline value and plotted as mean ± S.E. Normalized FRET ratios were combined from four independent experiments (CKAR-PB1Par6 traces) or five independent experiments (CKAR and CKAR-PB1p62 traces), with each experiment analyzing 4–12 selected cells. C, HA-PKCζ was co-expressed with CKAR, CKAR-PB1p62, or CKAR-PB1Par6 in COS-7 cells, immunoprecipitated (IP) from soluble lysates using anti-HA antibody, and blotted for co-IP of CKAR tag using anti-GFP antibody; whole cell lysate was loaded at 10% input.
FIGURE 3.
FIGURE 3.
Negative charge at Ser-24/Ala-30 in the PB1 domains of p62 and Par6α impairs binding of PKCζ and activity on CKAR-PB1Par6. A, diagram showing consensus within the PB1 domain for the Ser-24 site of p62 versus the Ala-30 site of Par6α and corresponding Ser sites in Par6β and Par6γ. B, HA-PKCζ was co-expressed with either wild-type (WT) or A30D mutation of CKAR-PB1Par6 in COS-7, immunoprecipitated from soluble lysates using anti-HA antibody, and blotted for co-IP of CKAR tag using anti-GFP antibody, and whole cell lysate was loaded at 10% input. C and D, basal kinase activity of mCherry-PKCζ versus mCherry-Vec on either WT or A30D CKAR-PB1Par6 (C) or WT, S24A, or S24D CKAR-PB1p62 (D) after treatment with 5 μm PZ09 in live COS-7 cells. The trace for each cell imaged was normalized to its t = 0-min baseline value and plotted as means ± S.E. Normalized FRET ratios were combined from four independent experiments (all traces in C and CKAR-PB1p62 S24A Vec trace in D), five independent experiments (CKAR-PB1p62 WT traces and CKAR-PB1p62 S24D Vec trace), or six independent experiments (CKAR-PB1p62 S24A and CKAR-PB1p62 S24D PKCζ traces) with each experiment analyzing 6–13 selected cells. E, HA-PKCζ was co-expressed with WT CFP-PB1p62, treated for 24 h prior to lysis with either DMSO or 50 μm forskolin (Fsk) in COS-7, immunoprecipitated from soluble lysates using anti-HA antibody, and blotted for co-IP of CKAR tag using anti-GFP antibody along with a phospho-specific antibody for Ser(P)-24 p62; whole cell lysate was loaded at 10% input.
FIGURE 4.
FIGURE 4.
Basal activity of PKCζ is regulated by a combination of autoinhibition and scaffold-regulated localization or sequestration. A, domain schematic of PKCζ, PKMζ, and deletion constructs ΔPS (deleted pseudosubstrate) and ΔPB1 (deleted PB1 domain) used in basal activity assays. B–D, basal kinase activity of mCherry-PKCζ versus mCherry-tagged deletion constructs and mCherry-Vec control on CKAR (B), CKAR-PB1p62 (C), and CKAR-PB1Par6 (D) in COS-7 cells treated with 5 μm PZ09. The trace for each cell imaged was normalized to its t = 0-min baseline value and plotted as means ± S.E. Normalized FRET ratios were combined from three independent experiments (CKAR PKMζ and ΔPB1 traces in B), four independent experiments (CKAR ΔPS trace in B, CKAR-PB1p62 PKMζ and ΔPB1 traces in C, and all traces in D), or five independent experiments (CKAR PKCζ and Vec traces in B and CKAR-PB1p62 PKCζ, ΔPS, and Vec traces in C) with each experiment analyzing 4–12 selected cells. E, HA-PKCζ or HA-PKMζ were co-expressed with CKAR-PB1Par6 or CKAR in COS-7. aPKC was immunoprecipitated from soluble lysates using anti-HA antibody and blotted for co-IP of CKAR using anti-GFP antibody; whole cell lysate loaded at 10% input. The band sizes of CKAR-PB1, HA-PKCζ, CKAR, and HA-PKMζ detected in the overexposed anti-GFP blot are indicated with red arrows, as the αGFP antibody detected overexpressed aPKC as well as the fluorophores.
FIGURE 5.
FIGURE 5.
PKMζ is more sensitive to dephosphorylation than PKCζ and active on global substrates, although both are basally active on MARK2 substrate. A, immunoblots showing activation loop phosphorylation (p410 PKCζ) of mCherry (mCh)-PKMζ versus mCherry-PKCζ expressed in COS-7 cells treated with either DMSO vehicle or 1 μm staurosporine (staur) for 2 h prior to lysis. The p410/total PKCζ ratios were quantified from four (PKMζ) or five (PKCζ) independent experiments, normalized to DMSO controls, and plotted as mean ± S.E. Statistical analysis was performed using two separate t tests comparing staurosporine treatment versus DMSO control for each protein. Significance was notated as ***, p < 0.001, or n.s., not significant. B, immunoblots of COS-7 co-expressing mCherry-MARK2 and either vector, HA-tagged wild-type (WT) PKMζ, or PKCζ or kinase-dead (KD) PKCζ. The p595/total MARK2 ratios were quantified from six (PKCζ KD) or seven (Vec, PKCζ WT, and PKMζ WT) independent experiments, normalized to Vec-transfected control and plotted as means ± S.E. Statistical analysis was performed using ordinary two-way analysis of variance followed by Dunnett's multiple comparison test with Vec as control. Significance notated as **** (p < 0.0001); *** (p < 0.001); or n.s., not significant. C, images of live COS-7 expressing mCherry-MARK2 alone or co-expressed with YFP-tagged WT or KD versions of PKMζ or PKCζ.
FIGURE 6.
FIGURE 6.
Scaffold proteins differentially regulate the phosphorylation and localization of the aPKC substrate MARK2. A, immunoblots of COS-7 co-expressing mCherry-MARK2 (mCh-MARK2) and either vector, HA-PKCζ, CFP-IRS-1, CFP-PB1p62, or CFP-PB1Par6. The p595/total MARK2 ratios were quantified from five (PB1Par6), six (IRS-1), or seven (Vec, PKCζ, and PB1p62) independent experiments, normalized to Vec-transfected control, and plotted as means ± S.E. Statistical analysis was performed using separate t tests between each co-expression (PKCζ, IRS-1, PB1p62, and PB1Par6) and Vec control. Significance notated as ***, p < 0.001; **, p < 0.01; or n.s., not significant. B, images of live COS-7 expressing mCherry-MARK2 alone or co-expressed with YFP-tagged PKCζ, CFP-IRS-1, CFP-PB1p62, or CFP-PB1Par6.
FIGURE 7.
FIGURE 7.
Insulin regulates the localization of scaffolded PKCζ. A, schematic showing of FRET-based translocation assay. CFP is tagged to the destination protein (IRS-1 or p62); YFP is tagged to the translocating protein (p62 or PKCζ), and mCherry is tagged to the third protein to confirm cellular expression. B, CHO-IR cells expressing the indicated proteins were serum-starved overnight, and FRET over CFP was measured before and after treatment with 100 nm insulin: 1) YFP-p62 with CFP-IRS-1 and mCherry-PKCζ (p62 to PKCζ); 2) YFP-PKCζ with CFP-IRS-1 and mCherry-p62 (PKCζ to IRS-1); and 3) YFP-PKCζ with CFP-p62 and mCherry-IRS-1 (PKCζ to p62). The trace for each responding cell imaged was normalized to its t = 0-min baseline value and plotted as means ± S.E. Normalized FRET ratios were combined from four independent experiments with each experiment analyzing 4–7 selected cells. C, model showing regulation of the localization and activity of aPKC by protein scaffolds. Non-scaffolded aPKC is effectively autoinhibited by intramolecular interactions that mask the active site of the kinase domain (cyan circle). Binding through the PB1 domain (purple) of scaffolds such as p62 (light blue) or Par6 (dark blue) results in partial or complete removal of the pseudosubstrate (green triangle) from the substrate binding cavity, resulting in low (p62) to maximal (Par6) activity at the scaffold. Agonists such as insulin relocalize these scaffolds, for example recruiting the aPKC:p62 complex to IRS-1 where it can phosphorylate proximal substrates to affect downstream signaling.

Similar articles

Cited by

References

    1. Langeberg L. K., and Scott J. D. (2015) Signalling scaffolds and local organization of cellular behaviour. Nat. Rev. Mol. Cell Biol. 16, 232–244 - PMC - PubMed
    1. Newton A. C. (2001) Protein kinase C: structural and spatial regulation by phosphorylation, cofactors, and macromolecular interactions. Chem. Rev. 101, 2353–2364 - PubMed
    1. Newton A. C. (2010) Protein kinase C: poised to signal. Am. J. Physiol. Endocrinol. Metab. 298, E395–E402 - PMC - PubMed
    1. Parker P. J., and Murray-Rust J. (2004) PKC at a glance. J. Cell Sci. 117, 131–132 - PubMed
    1. Tobias I. S., Kaulich M., Kim P. K., Simon N., Jacinto E., Dowdy S. F., King C. C., and Newton A. C. (2016) Protein kinase Cζ exhibits constitutive phosphorylation and phosphatidylinositol-3,4,5-triphosphate-independent regulation. Biochem. J. 473, 509–523 - PMC - PubMed

Publication types

MeSH terms