Insights into the Tunnel Mechanism of Cholesteryl Ester Transfer Protein through All-atom Molecular Dynamics Simulations
- PMID: 27143480
- PMCID: PMC4933163
- DOI: 10.1074/jbc.M116.715565
Insights into the Tunnel Mechanism of Cholesteryl Ester Transfer Protein through All-atom Molecular Dynamics Simulations
Abstract
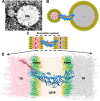
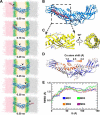
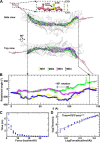
Cholesteryl ester transfer protein (CETP) mediates cholesteryl ester (CE) transfer from the atheroprotective high density lipoprotein (HDL) cholesterol to the atherogenic low density lipoprotein cholesterol. In the past decade, this property has driven the development of CETP inhibitors, which have been evaluated in large scale clinical trials for treating cardiovascular diseases. Despite the pharmacological interest, little is known about the fundamental mechanism of CETP in CE transfer. Recent electron microscopy (EM) experiments have suggested a tunnel mechanism, and molecular dynamics simulations have shown that the flexible N-terminal distal end of CETP penetrates into the HDL surface and takes up a CE molecule through an open pore. However, it is not known whether a CE molecule can completely transfer through an entire CETP molecule. Here, we used all-atom molecular dynamics simulations to evaluate this possibility. The results showed that a hydrophobic tunnel inside CETP is sufficient to allow a CE molecule to completely transfer through the entire CETP within a predicted transfer time and at a rate comparable with those obtained through physiological measurements. Analyses of the detailed interactions revealed several residues that might be critical for CETP function, which may provide important clues for the effective development of CETP inhibitors and treatment of cardiovascular diseases.
Keywords: cholesterol; cholesterol metabolism; cholesterol regulation; cholesterol-binding protein; lipid metabolism; lipid transport; lipid-protein interaction; lipoprotein metabolism; molecular dynamics.
© 2016 by The American Society for Biochemistry and Molecular Biology, Inc.
Figures


Similar articles
-
Structural Plasticity of Cholesteryl Ester Transfer Protein Assists the Lipid Transfer Activity.J Biol Chem. 2016 Sep 9;291(37):19462-73. doi: 10.1074/jbc.M116.744623. Epub 2016 Jul 20. J Biol Chem. 2016. PMID: 27445332 Free PMC article.
-
Steering the Lipid Transfer To Unravel the Mechanism of Cholesteryl Ester Transfer Protein Inhibition.Biochemistry. 2019 Sep 10;58(36):3789-3801. doi: 10.1021/acs.biochem.9b00301. Epub 2019 Aug 22. Biochemistry. 2019. PMID: 31418269
-
Structural basis of transfer between lipoproteins by cholesteryl ester transfer protein.Nat Chem Biol. 2012 Feb 19;8(4):342-9. doi: 10.1038/nchembio.796. Nat Chem Biol. 2012. PMID: 22344176 Free PMC article.
-
Structure-based mechanism and inhibition of cholesteryl ester transfer protein.Curr Atheroscler Rep. 2023 Apr;25(4):155-166. doi: 10.1007/s11883-023-01087-1. Epub 2023 Mar 7. Curr Atheroscler Rep. 2023. PMID: 36881278 Free PMC article. Review.
-
Structural and biophysical insight into cholesteryl ester-transfer protein.Biochem Soc Trans. 2011 Aug;39(4):1000-5. doi: 10.1042/BST0391000. Biochem Soc Trans. 2011. PMID: 21787337 Review.
Cited by
-
Assessing the mechanisms of cholesteryl ester transfer protein inhibitors.Biochim Biophys Acta Mol Cell Biol Lipids. 2017 Dec;1862(12):1606-1617. doi: 10.1016/j.bbalip.2017.09.004. Epub 2017 Sep 12. Biochim Biophys Acta Mol Cell Biol Lipids. 2017. PMID: 28911944 Free PMC article.
-
Single-Molecule 3D Images of "Hole-Hole" IgG1 Homodimers by Individual-Particle Electron Tomography.Sci Rep. 2019 Jun 20;9(1):8864. doi: 10.1038/s41598-019-44978-7. Sci Rep. 2019. PMID: 31221961 Free PMC article.
-
Molecular dynamics simulations of lipid nanodiscs.Biochim Biophys Acta Biomembr. 2018 Oct;1860(10):2094-2107. doi: 10.1016/j.bbamem.2018.04.015. Epub 2018 May 3. Biochim Biophys Acta Biomembr. 2018. PMID: 29729280 Free PMC article.
-
How cholesteryl ester transfer protein can also be a potential triglyceride transporter.Sci Rep. 2017 Jul 21;7(1):6159. doi: 10.1038/s41598-017-05449-z. Sci Rep. 2017. PMID: 28733595 Free PMC article.
-
Characterization of Lipid-Protein Interactions and Lipid-Mediated Modulation of Membrane Protein Function through Molecular Simulation.Chem Rev. 2019 May 8;119(9):6086-6161. doi: 10.1021/acs.chemrev.8b00608. Epub 2019 Apr 12. Chem Rev. 2019. PMID: 30978005 Free PMC article. Review.
References
-
- Mozaffarian D., Benjamin E. J., Go A. S., Arnett D. K., Blaha M. J., Cushman M., de Ferranti S., Després J. P., Fullerton H. J., Howard V. J., Huffman M. D., Judd S. E., Kissela B. M., Lackland D. T., Lichtman J. H., et al. (2015) Heart disease and stroke statistics—2015 update: a report from the American Heart Association. Circulation 131, e29–e322 - PubMed
-
- Gordon T., Castelli W. P., Hjortland M. C., Kannel W. B., and Dawber T. R. (1977) High density lipoprotein as a protective factor against coronary heart disease. Am. J. Med. 62, 707–714 - PubMed
-
- Camejo G., Waich S., Quintero G., Berrizbeitia M. L., and Lalaguna F. (1976) The affinity of low density lipoproteins for an arterial macromolecular complex. A study in ischemic heart disease and controls. Atherosclerosis 24, 341–354 - PubMed
-
- Tall A. R. (1986) Plasma lipid transfer proteins. J. Lipid Res. 27, 361–367 - PubMed
-
- Brown M. L., Inazu A., Hesler C. B., Agellon L. B., Mann C., Whitlock M. E., Marcel Y. L., Milne R. W., Koizumi J., Mabuchi H., Takeda R., and Tall A. R. (1989) Molecular basis of lipid transfer protein deficiency in a family with increased high-density lipoproteins. Nature 342, 448–451 - PubMed
Publication types
MeSH terms
Substances
Associated data
- Actions
Grants and funding
LinkOut - more resources
Full Text Sources
Other Literature Sources
Miscellaneous

