. 2016 Jun 1;310(11):E1036-52.
doi: 10.1152/ajpendo.00010.2016. Epub 2016 May 3.

Loss of CTRP5 improves insulin action and hepatic steatosis

Affiliations

Loss of CTRP5 improves insulin action and hepatic steatosis

Xia Lei et al. Am J Physiol Endocrinol Metab. .

Abstract

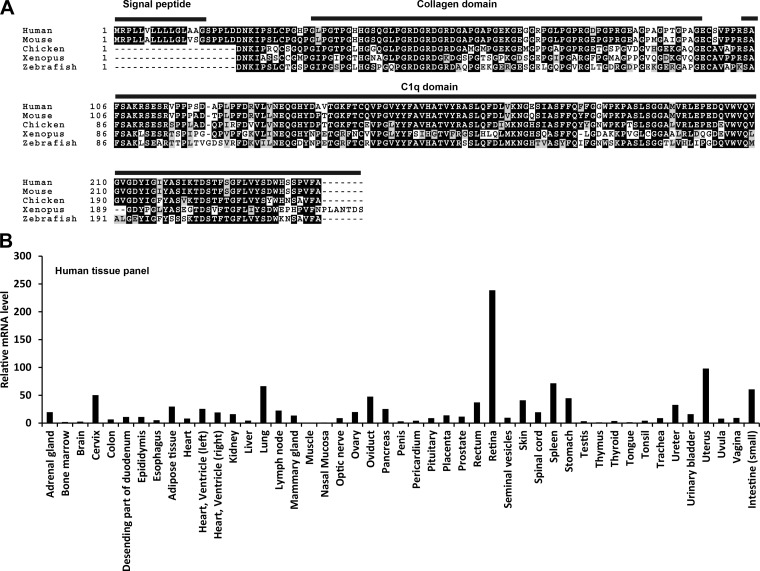
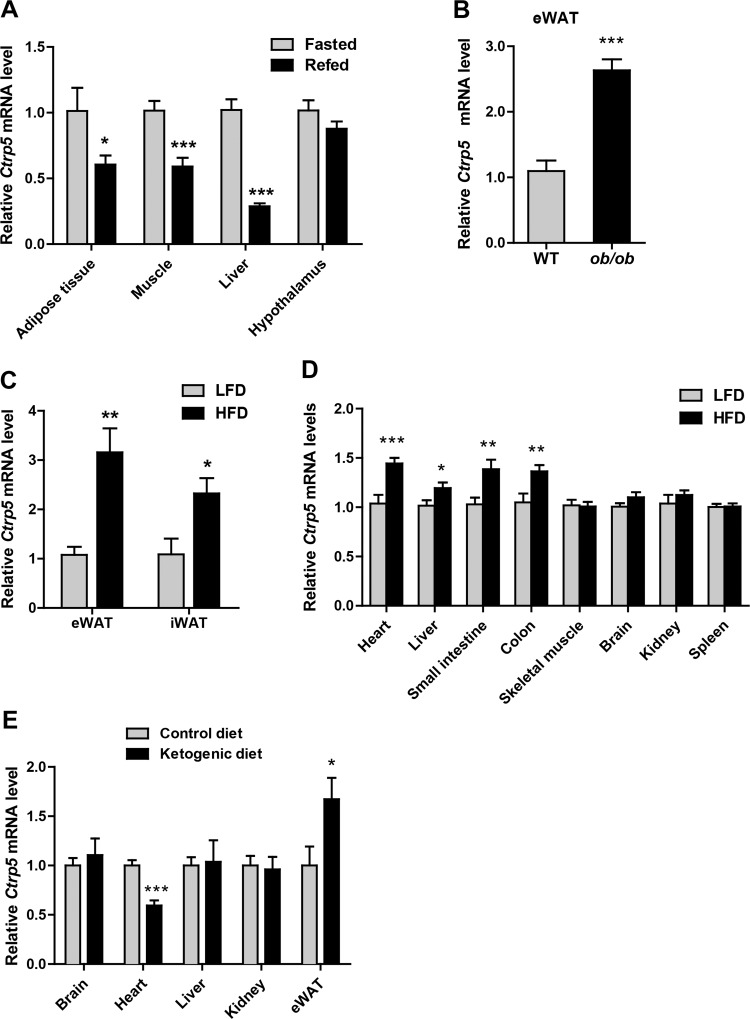
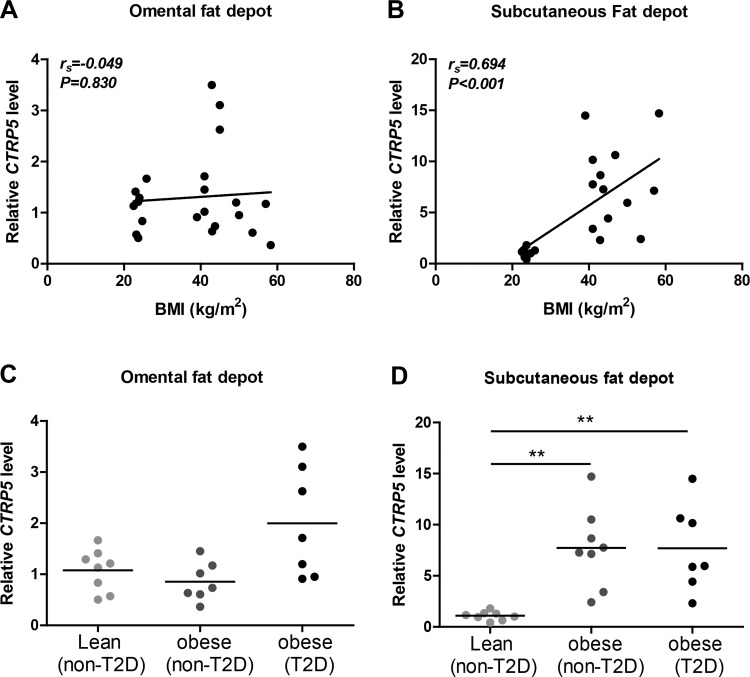
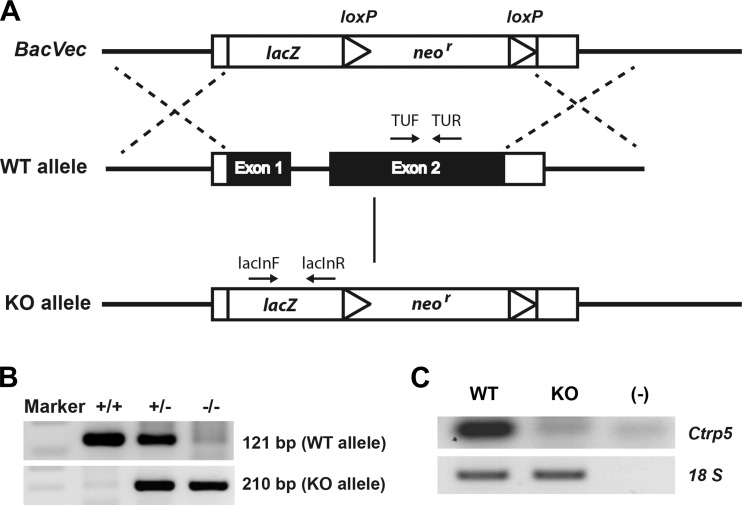
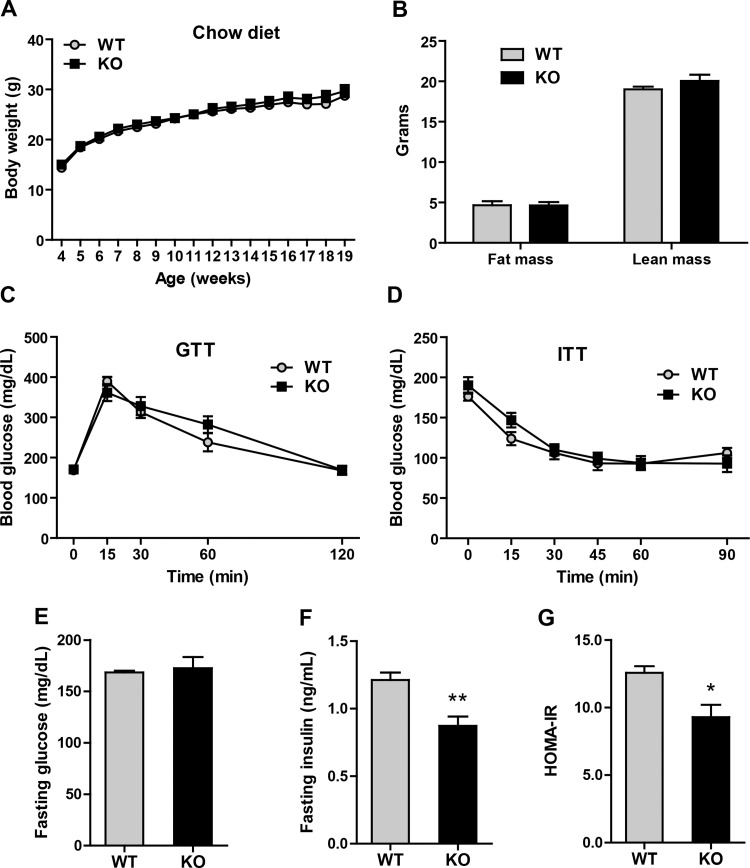
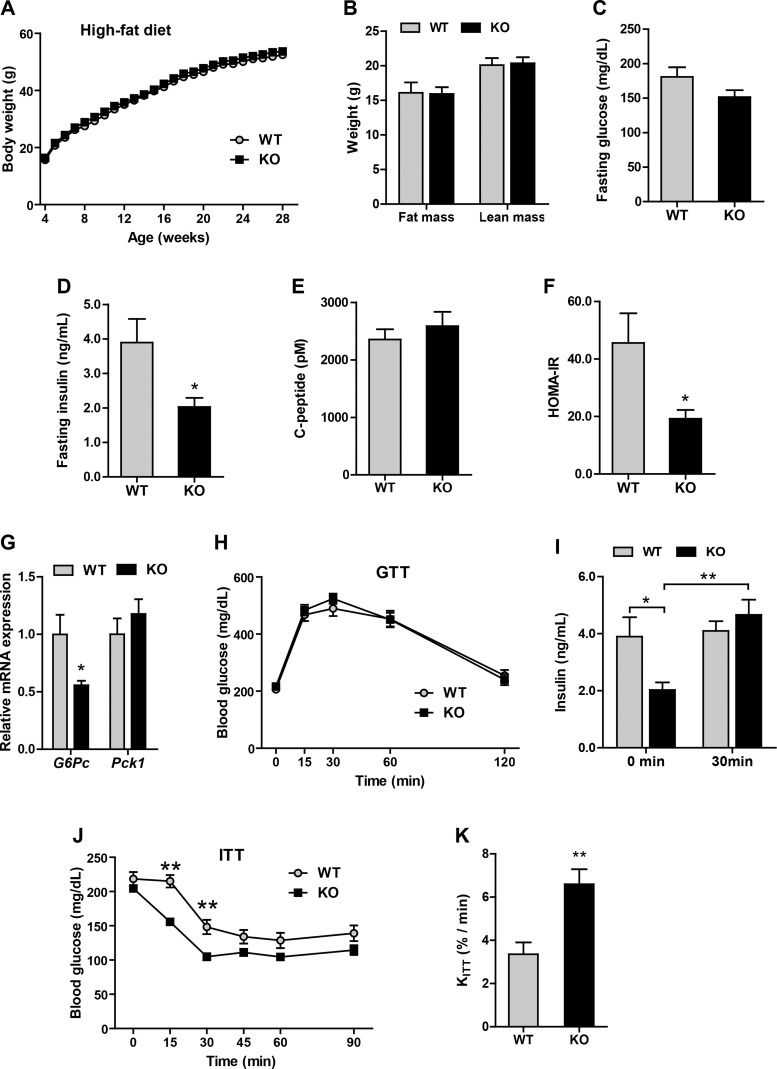
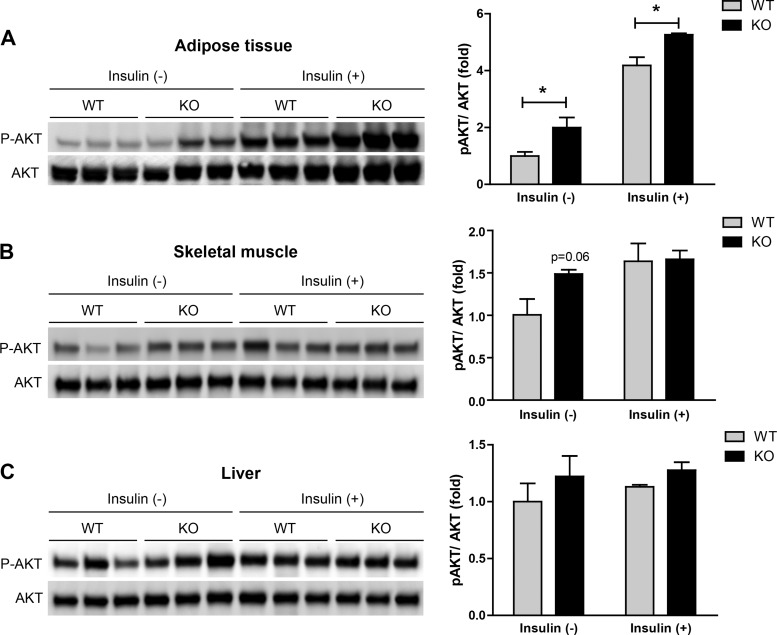
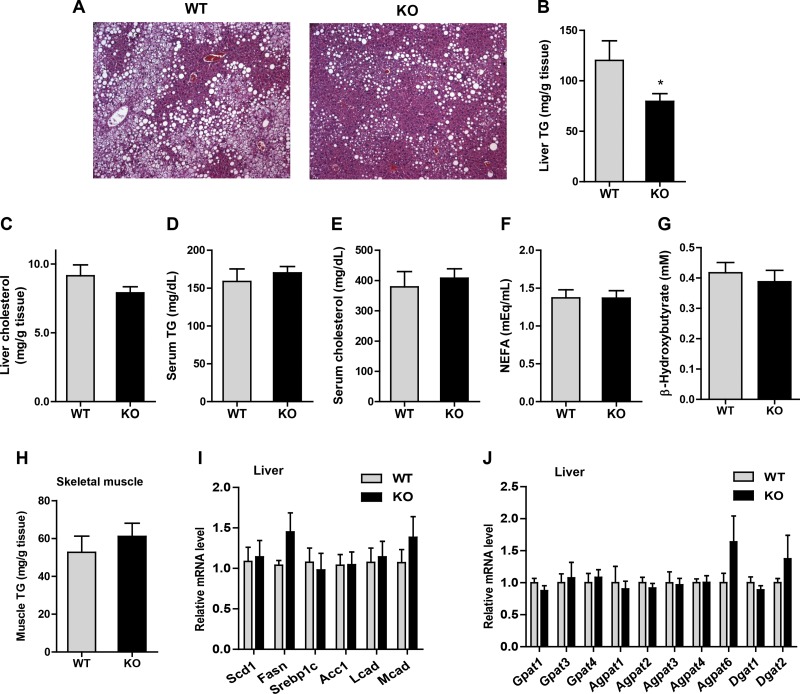
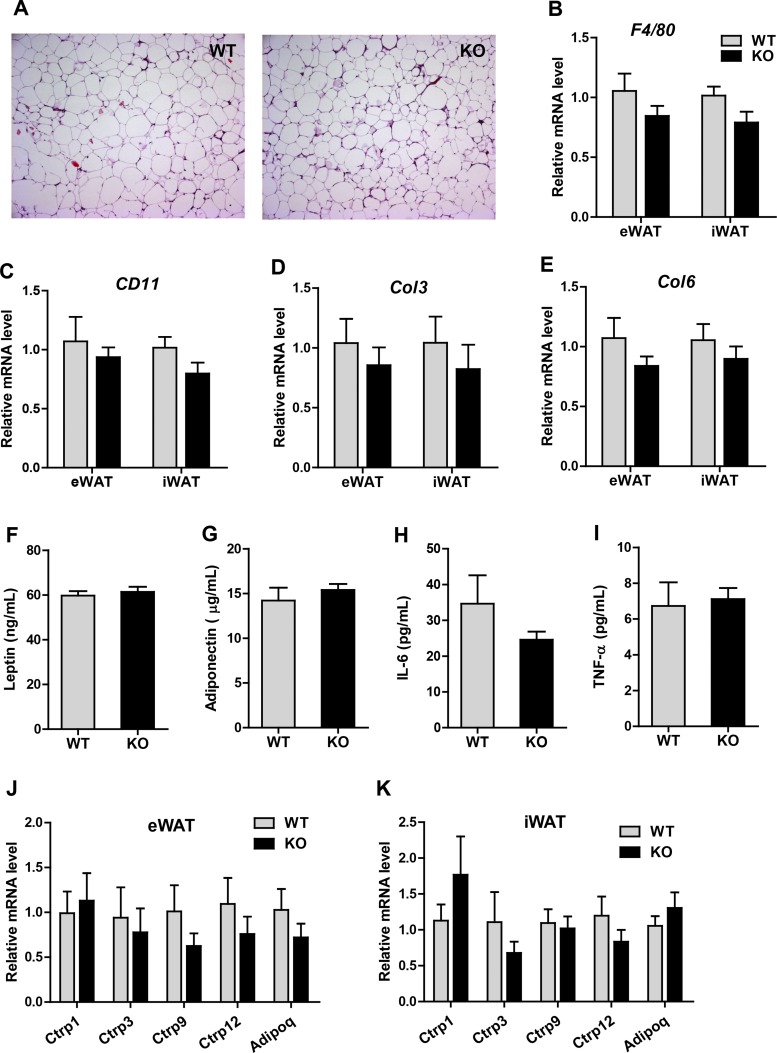
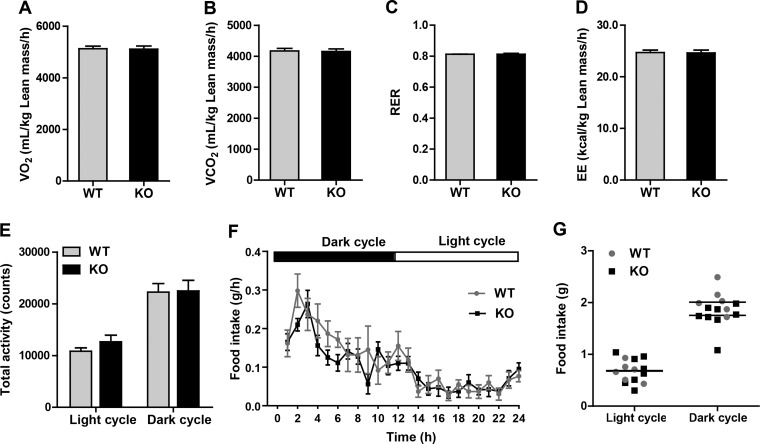
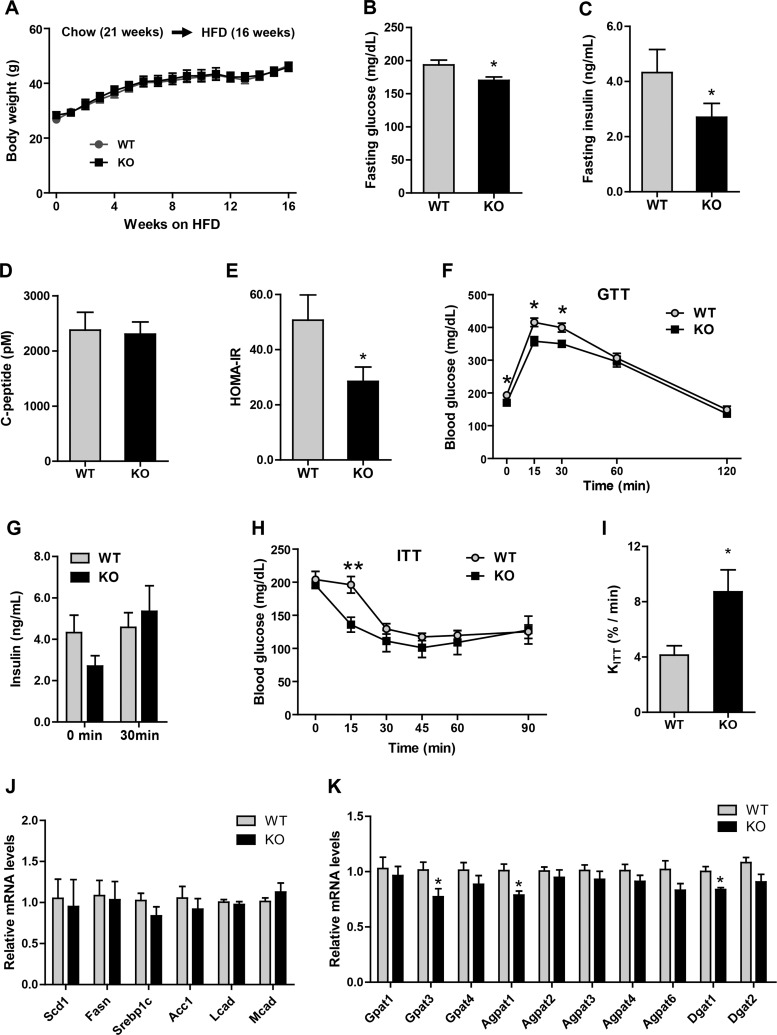
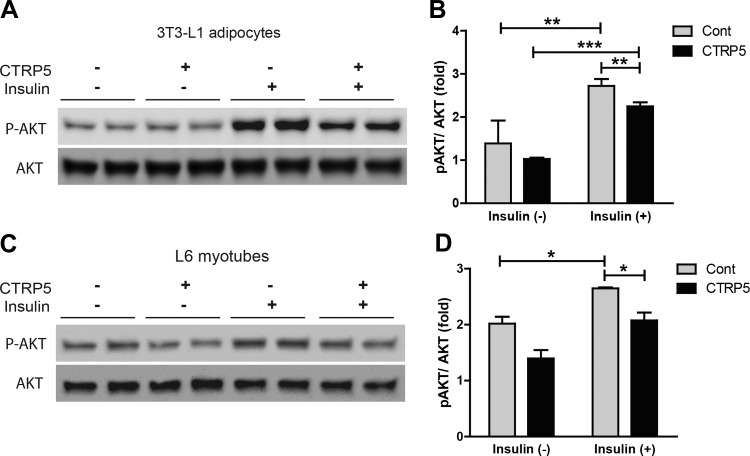
The gene that encodes C1q/TNF-related protein 5 (CTRP5), a secreted protein of the C1q family, is mutated in individuals with late-onset retinal degeneration. CTRP5 is widely expressed outside the eye and also circulates in plasma. Its physiological role in peripheral tissues, however, has yet to be elucidated. Here, we show that Ctrp5 expression is modulated by fasting and refeeding, and by different diets, in mice. Adipose expression of CTRP5 was markedly upregulated in obese and diabetic humans and in genetic and dietary models of obesity in rodents. Furthermore, human CTRP5 expression in the subcutaneous fat depot positively correlated with BMI. A genetic loss-of-function mouse model was used to address the metabolic function of CTRP5 in vivo. On a standard chow diet, CTRP5-deficient mice had reduced fasting insulin but were otherwise comparable with wild-type littermate controls in body weight and adiposity. However, when fed a high-fat diet, CTRP5-deficient animals had attenuated hepatic steatosis and improved insulin action. Loss of CTRP5 also improved the capacity of chow-fed aged mice to respond to subsequent high-fat feeding, as evidenced by decreased insulin resistance. In cultured adipocytes and myotubes, recombinant CTRP5 treatment attenuated insulin-stimulated Akt phosphorylation. Our results provide the first genetic and physiological evidence for CTRP5 as a negative regulator of glucose metabolism and insulin sensitivity. Inhibition of CTRP5 action may result in the alleviation of insulin resistance associated with obesity and diabetes.

Keywords: C1QTNF5; C1q/TNF-related protein 5; adipokine; diabetes; insulin sensitivity; obesity.


Figures

Fig. 1.
Fig. 1.
Evolutionary conservation of C1q/TNF-related protein 5 (CTRP5) in vertebrates and its tissue expression profile in humans. A: sequence alignment of human (NP_001265360), mouse (NP_001177248), chicken (XP_001232467), frog (Xenopus; XP_002935065), and zebrafish (NP_001025124) CTRP5 using a web-based Clustal W (version 2) tool (26). Identical amino acids are shaded black, and similar amino acids are shaded gray. Shading was done using the web-based BoxShade tool. The NH2-terminal signal peptide collagen domain (with G-X-Y repeats) and the COOH-terminal globular C1q domain are indicated. B: quantitative real-time PCR analysis of human CTRP5 mRNA expression across 47 tissue types. Expression levels of CTRP5 in each tissue were normalized to GAPDH.
Fig. 2.
Fig. 2.
Ctrp5 expression in different metabolic states. A: quantitative real-time PCR analysis of Ctrp5 expression in epididymal white adipose tissue (eWAT), skeletal muscle, liver, and hypothalamus of mice subjected to overnight fast (fasted group; n = 7) or overnight fast followed by 3 h of refeeding (refed group; n = 8). Expression levels were normalized to β-actin. B and C: quantitative real-time PCR analysis of Ctrp5 expression in eWAT from leptin-deficient ob/ob (n = 10) and wild-type (WT) lean controls (n = 9) or in eWAT and inguinal white adipose tissue (iWAT) from mice fed a control low-fat diet (LFD; n = 8) vs. a high-fat diet (HFD; n = 8). D: expression levels of Ctrp5 in the brain and peripheral tissues of a separate cohort of LFD-fed (n = 11) and HFD-fed (n = 11) mice. Expression levels were normalized to β-actin. E: quantitative real-time PCR analysis of Ctrp5 expression in brain, heart, liver, kidney, and eWAT from mice fed a ketogenic diet (n = 8) or matched control diet (n = 8). Expression levels were normalized to the average of 18s rRNA, Gapdh, β-actin, and Rpl-22. *P < 0.05; **P < 0.01; ***P < 0.001.
Fig. 3.
Fig. 3.
Expression of CTRP5 in lean and obese humans. Quantitative real-time PCR analysis of CTRP5 in omental (A and C) or subcutaneous (B and D) adipose tissue of human abdominal surgery subjects. Expression of CTRP5 in the subcutaneous fat depot is positively correlated with body mass index (BMI; B). Expression levels of CTRP5 are higher in obese individuals with or without type 2 diabetes relative to lean individuals (n = 7–8; D). Expression levels were normalized to β-actin levels in each sample. **P < 0.01.
Fig. 4.
Fig. 4.
Generation of Ctrp5-null mice. A: schematic showing the strategy for generating Ctrp5 knockout (KO) mice. The entire Ctrp5 gene, comprising two exons, was replaced by a neomycin resistance gene and lacZ reporter cassette. B: PCR genotyping results show the successful generation of wild-type (WT; +/+), heterozygous (+/−), and homozygous KO (−/−) alleles using the indicated primer pairs (TUF and TUR for WT allele, lacInF, and lacInR for KO allele) shown in A. C: the absence of Ctrp5 mRNA in eWAT from the KO mice was confirmed by RT-PCR with primers specific for Ctrp5 (mCtrp5F and mCtrp5R).
Fig. 5.
Fig. 5.
Metabolic phenotypes of Ctrp5-null mice fed a standard laboratory chow diet. A: body weight of wild-type (WT) and knockout (KO) male mice over time. B: fat and lean mass in WT and KO mice quantified by Echo-MRI. C: WT and KO blood glucose levels were measured at the indicated time points during glucose tolerance test (GTT). D: WT and KO blood glucose levels were measured at the indicated time points during insulin tolerance test (ITT). E and F: fasting blood glucose and insulin levels. G: calculated insulin resistance (HOMA-IR) index for WT and KO mice at 20 wk of age. WT, n = 7; KO, n = 8. *P < 0.05; **P < 0.01.
Fig. 6.
Fig. 6.
Improved insulin sensitivity in Ctrp5-null mice fed a high-fat diet. A: body weight of wild-type (WT) and knockout (KO) male mice over time. B: fat and lean mass in WT and KO mice quantified by Echo-MRI at 21 wk of age. CF: fasting blood glucose, insulin, and C-peptide levels as well as the calculated insulin resistance (HOMA-IR) index for WT and KO mice at 20 wk of age. G: real-time PCR for gluconeogenic gene (G6Pc and Pck1) expression in liver of WT and KO mice. H: blood glucose levels for WT and KO mice were measured at the indicated time points during glucose tolerance test (GTT). I: WT and KO serum insulin levels at 0 and 30 min after glucose injection. J: WT and KO blood glucose levels were measured at the indicated time point during insulin tolerance test (ITT). K: the decay constant (KITT) for WT and KO mice based on the ITT data. WT, n = 8; KO, n = 7. *P < 0.05; **P < 0.01.
Fig. 7.
Fig. 7.
Insulin-stimulated Akt phosphorylation in Ctrp5-null adipose tissue, skeletal muscle, and liver. Quantitative Western blot analysis of insulin-stimulated Akt (Ser473) phosphorylation in adipose tissue (A), skeletal muscle (B), and liver (C) of WT and KO mice injected with insulin (1 U/kg body wt). Tissues were harvested at 15 min post-insulin injection. A total of 10 μg protein lysate from each sample was loaded onto Western blot gels. *P < 0.05.
Fig. 8.
Fig. 8.
Lipid and adipokine profiles of Ctrp5-null mice fed a high-fat diet. A: representative histological sections of liver from WT and KO mice stained with hematoxylin and eosin. B and C: liver triglyceride and cholesterol levels of WT and KO mice. DG: serum concentrations of triglycerides, cholesterol, and nonesterified free fatty acids (NEFA) and β-hydroxybutyrate (ketone) in WT and KO mice. H: skeletal muscle triglyceride levels of WT and KO mice. I: quantitative PCR analysis of genes involved in de novo lipid synthesis (Scd1, Fasn, Srebp1c, and Acc1) and fat oxidation (Lcad and Mcad) in WT and KO mouse liver. J: expression of genes (Gpat, Agpat, and Dgat) involved in triglyceride synthesis in WT and KO mouse liver. All expression levels were normalized to 18s rRNA. WT, n = 8; KO, n = 7. *P < 0.05.
Fig. 9.
Fig. 9.
Inflammatory and fibrotic states of adipose tissue in Ctrp5-null mice. A: representative histological sections of eWAT from WT and KO mice stained with hematoxylin and eosin. B and C: quantitative PCR analysis of macrophage marker genes (F4/80 and Cd11) in visceral (epididymal; eWAT) and subcutaneous (inguinal; iWAT) white adipose tissue. D and E: expression levels of fibrotic collagen genes (Col3 and Col6) in the visceral (eWAT) and subcutaneous (iWAT) fat depots of WT and KO mice. FI: ELISA quantification of serum leptin, adiponectin, IL-6, and TNFα levels in WT and KO mice. J and K: expression levels of adiponectin and CTRPs in the eWAT and iWAT of WT and KO mice. All expression levels were normalized to 18s rRNA levels. WT, n = 8; KO, n = 7.
Fig. 10.
Fig. 10.
Indirect calorimetry analysis of Ctrp5-null mice fed a high-fat diet. AD: oxygen consumption (V̇o2), CO2 production (V̇co2), respiratory exchange ratio (RER), and energy expenditure (EE) for male WT and KO mice at 22 wk of age. E: total physical activity levels for WT and KO mice during the dark and light phases of the photocycle. F: real-time food intake measurements for WT and KO mice during the dark and light phases of the photocycle. G: cumulative food intake (over a 12-h period) for WT and KO mice in the dark and light phases of the photocycle. (WT, n = 6; KO, n = 8).
Fig. 11.
Fig. 11.
Reduced insulin resistance and hepatic triglyceride synthesis gene expression in aged Ctrp5-null mice fed a high-fat diet later in life. Weaned WT and KO male mice were fed a chow diet for 21 wk and then a HFD for 16 wk. A: body weights of male WT (n = 9) and KO (n = 7) mice after being switched to a HFD. BE: fasting blood glucose, serum insulin, and C-peptide levels as well as the calculated insulin resistance (HOMA-IR) index of aged WT and KO mice after high-fat feeding for 16 wk. F: blood glucose levels of WT (n = 7) and KO (n = 5) mice at the indicated time points during glucose tolerance test (GTT). G: serum insulin levels were measured in the same group of mice during GTT. H: blood glucose levels of WT (n = 7) and KO (n = 5) mice at the indicated time points during insulin tolerance test (ITT). I: the decay constant (KITT) for WT and KO mice based on the ITT data. J: quantitative PCR analysis of genes involved in de novo lipid synthesis (Scd1, Fasn, Srebp1c, and Acc1) and fat oxidation (Lcad and Mcad) in WT and KO mouse liver. K: expression of genes (Gpat, Agpat, and Dgat) involved in triglyceride synthesis in WT and KO mouse liver. Food was removed for 3 h before liver tissue was harvested from mice. Expression levels were normalized to 18s rRNA levels. WT, n = 7; KO, n = 6. *P < 0.05; **P < 0.01.
Fig. 12.
Fig. 12.
Recombinant mouse CTRP5 attenuates insulin-stimulated Akt phosphorylation. A and C: mouse 3T3-L1 adipocytes (A) and rat L6 myotubes (C) were treated overnight with control conditioned medium or conditioned medium containing recombinant mouse CTRP5. The following day, cells were washed once and then stimulated with vehicle control or 100 nM insulin for 5 min. Cell lysates were then subjected to Western blot analysis with total and phosphorylated Akt antibodies. B: quantification of immunoblot results for 3T3-L1 adipocytes based on 2 independent experiments (n = 4). C: quantification of immunoblot results for L6 myotubes based on 2 independent experiments (n = 4). *P < 0.05; **P < 0.01; ***P < 0.001.

Similar articles

Cited by

References

    1. Alberti KG, Zimmet PZ. Definition, diagnosis and classification of diabetes mellitus and its complications. Part 1: diagnosis and classification of diabetes mellitus provisional report of a WHO consultation. Diabet Med 15: 539–553, 1998. - PubMed
    1. Ayyagari R, Mandal MN, Karoukis AJ, Chen L, McLaren NC, Lichter M, Wong DT, Hitchcock PF, Caruso RC, Moroi SE, Maumenee IH, Sieving PA. Late-onset macular degeneration and long anterior lens zonules result from a CTRP5 gene mutation. Invest Ophthalmol Vis Sci 46: 3363–3371, 2005. - PubMed
    1. Bonora E, Manicardi V, Zavaroni I, Coscelli C, Butturini U. Relationships between insulin secretion, insulin metabolism and insulin resistance in mild glucose intolerance. Diabete Metab 13: 116–121, 1987. - PubMed
    1. Brown MS, Goldstein JL. Selective versus total insulin resistance: a pathogenic paradox. Cell Metab 7: 95–96, 2008. - PubMed
    1. Bligh EG, Dyer WJ. A rapid method of total lipid extraction and purification. Can J Biochem Physiol 37: 911–917, 1959. - PubMed

Publication types