

Metabolic activity of brown, "beige," and white adipose tissues in response to chronic adrenergic stimulation in male mice
- PMID: 27143559
- PMCID: PMC4967144
- DOI: 10.1152/ajpendo.00545.2015
Metabolic activity of brown, "beige," and white adipose tissues in response to chronic adrenergic stimulation in male mice
Abstract
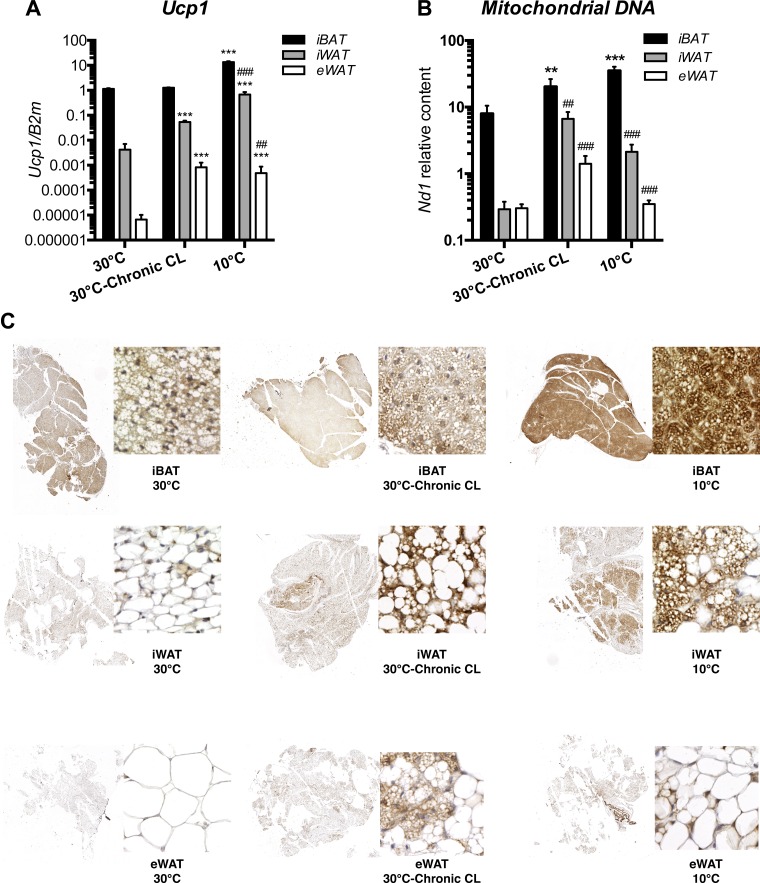
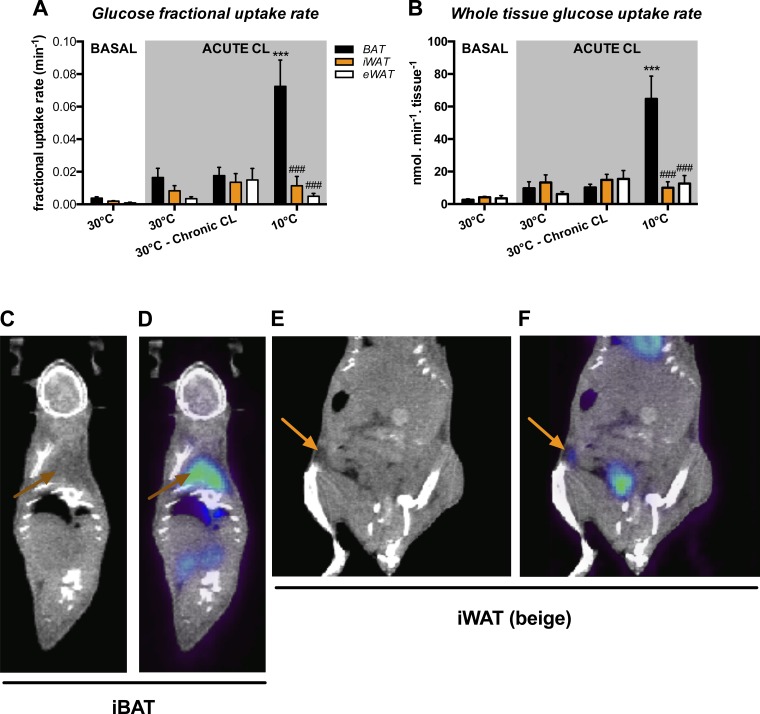
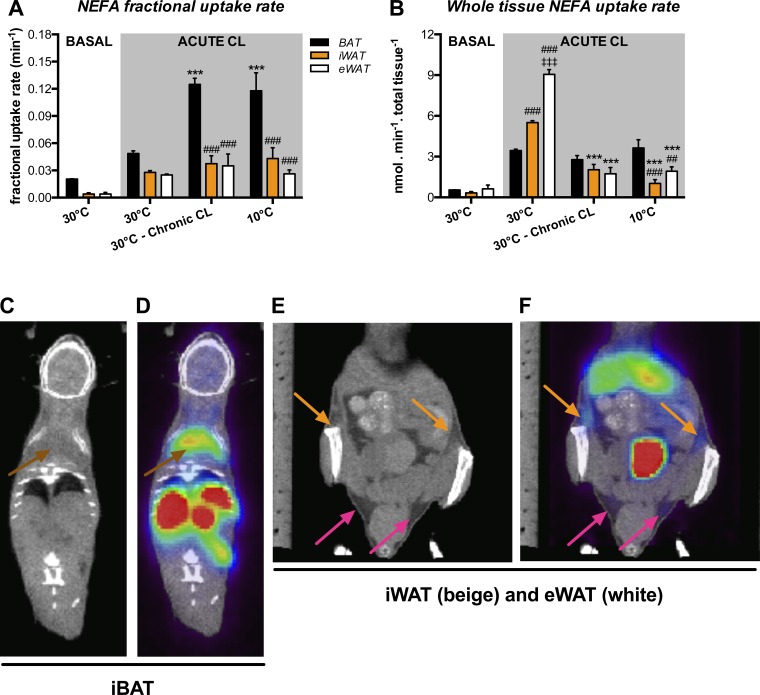
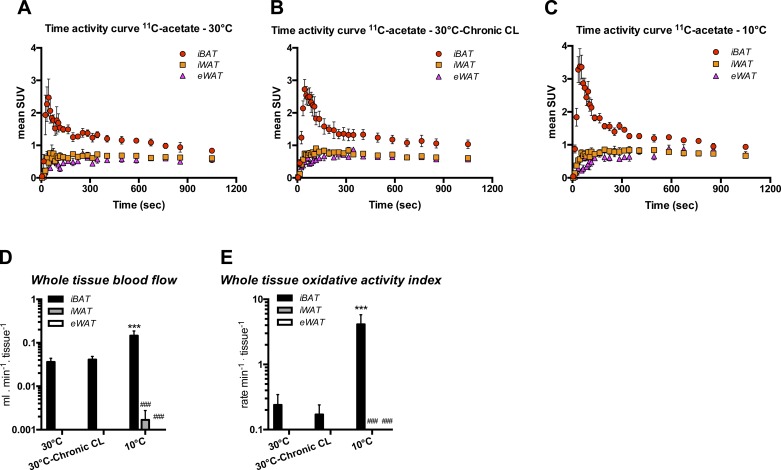
Classical brown adipocytes such as those found in interscapular brown adipose tissue (iBAT) represent energy-burning cells, which have been postulated to play a pivotal role in energy metabolism. Brown adipocytes can also be found in white adipose tissue (WAT) depots [e.g., inguinal WAT (iWAT)] following adrenergic stimulation, and they have been referred to as "beige" adipocytes. Whether the presence of these adipocytes, which gives iWAT a beige appearance, can confer a white depot with some thermogenic activity remains to be seen. In consequence, we designed the present study to investigate the metabolic activity of iBAT, iWAT, and epididymal white depots in mice. Mice were either 1) kept at thermoneutrality (30°C), 2) kept at 30°C and treated daily for 14 days with an adrenergic agonist [CL-316,243 (CL)], or 3) housed at 10°C for 14 days. Metabolic activity was assessed using positron emission tomography imaging with fluoro-[(18)F]deoxyglucose (glucose uptake), fluoro-[(18)F]thiaheptadecanoic acid (fatty acid uptake), and [(11)C]acetate (oxidative activity). In each group, substrate uptakes and oxidative activity were measured in anesthetized mice in response to acute CL. Our results revealed iBAT as a major site of metabolic activity, which exhibited enhanced glucose and nonesterified fatty acid uptakes and oxidative activity in response to chronic cold and CL. On the other hand, beige adipose tissue failed to exhibit appreciable increase in oxidative activity in response to chronic cold and CL. Altogether, our results suggest that the contribution of beige fat to acute-CL-induced metabolic activity is low compared with that of iBAT, even after sustained adrenergic stimulation.
Keywords: beige adipose tissue; brown adipose tissue; energy metabolism; oxidative metabolism; positron emission tomography.
Copyright © 2016 the American Physiological Society.
Figures
Similar articles
-
Interscapular brown adipose tissue denervation does not promote the oxidative activity of inguinal white adipose tissue in male mice.Am J Physiol Endocrinol Metab. 2018 Nov 1;315(5):E815-E824. doi: 10.1152/ajpendo.00210.2018. Epub 2018 Aug 28. Am J Physiol Endocrinol Metab. 2018. PMID: 30153064
-
Imaging adipose tissue browning using the TSPO-18kDa tracer [18F]FEPPA.Mol Metab. 2019 Jul;25:154-158. doi: 10.1016/j.molmet.2019.05.003. Epub 2019 May 6. Mol Metab. 2019. PMID: 31105057 Free PMC article.
-
Metabolic changes in adipose tissues in response to β3 -adrenergic receptor activation in mice.J Cell Biochem. 2019 Jan;120(1):821-835. doi: 10.1002/jcb.27443. Epub 2018 Sep 6. J Cell Biochem. 2019. PMID: 30191605
-
Browning of white fat: agents and implications for beige adipose tissue to type 2 diabetes.J Physiol Biochem. 2019 Feb;75(1):1-10. doi: 10.1007/s13105-018-0658-5. Epub 2018 Nov 30. J Physiol Biochem. 2019. PMID: 30506389 Free PMC article. Review.
-
Regulation of brown and beige fat by microRNAs.Pharmacol Ther. 2017 Feb;170:1-7. doi: 10.1016/j.pharmthera.2016.10.004. Epub 2016 Oct 11. Pharmacol Ther. 2017. PMID: 27742571 Review.
Cited by
-
Looking on the "brite" side exercise-induced browning of white adipose tissue.Pflugers Arch. 2019 Mar;471(3):455-465. doi: 10.1007/s00424-018-2177-1. Epub 2018 Jul 7. Pflugers Arch. 2019. PMID: 29982948 Review.
-
Emerging debates and resolutions in brown adipose tissue research.Cell Metab. 2025 Jan 7;37(1):12-33. doi: 10.1016/j.cmet.2024.11.002. Epub 2024 Dec 6. Cell Metab. 2025. PMID: 39644896 Review.
-
Endothelial SIRT-1 has a critical role in the maintenance of capillarization in brown adipose tissue.iScience. 2022 Oct 20;25(11):105424. doi: 10.1016/j.isci.2022.105424. eCollection 2022 Nov 18. iScience. 2022. PMID: 36388988 Free PMC article.
-
Protocol for inducing beige adipocytes in white adipose tissue of mouse using cold exposure and CL316,243 injection.STAR Protoc. 2025 Mar 21;6(1):103337. doi: 10.1016/j.xpro.2024.103337. Epub 2025 Jan 15. STAR Protoc. 2025. PMID: 39817914 Free PMC article.
-
Brown adipose tissue metabolism in women is dependent on ovarian status.Am J Physiol Endocrinol Metab. 2024 May 1;326(5):E588-E601. doi: 10.1152/ajpendo.00077.2024. Epub 2024 Mar 13. Am J Physiol Endocrinol Metab. 2024. PMID: 38477875 Free PMC article.
References
-
- Atit R, Sgaier SK, Mohamed OA, Taketo MM, Dufort D, Joyner AL, Niswander L, Conlon RA. Beta-catenin activation is necessary and sufficient to specify the dorsal dermal fate in the mouse. Dev Biol 296: 164–176, 2006. - PubMed
-
- Bessi VL, Labbé SM, Huynh DN, Ménard L, Jossart C, Febbraio M, Guérin B, Bentourkia M, Lecomte R, Carpentier AC, Ong H, Marleau S. EP 80317, a selective CD36 ligand, shows cardioprotective effects against post-ischaemic myocardial damage in mice. Cardiovasc Res 96: 99–108, 2012. - PubMed
-
- Blondin DP, Labbé SM, Noll C, Kunach M, Phoenix S, Guérin B, Turcotte EE, Haman F, Richard D, Carpentier AC. Selective impairment of glucose but not fatty acid or oxidative metabolism in brown adipose tissue of subjects with type 2 diabetes. Diabetes 64: 2388–2397, 2015. - PubMed
MeSH terms
Substances
LinkOut - more resources
Full Text Sources
Other Literature Sources
Molecular Biology Databases