. 2016 May 17;113(20):5730-5.
doi: 10.1073/pnas.1520489113. Epub 2016 May 3.

Nuclear receptor REV-ERBα mediates circadian sensitivity to mortality in murine vesicular stomatitis virus-induced encephalitis

Affiliations

Nuclear receptor REV-ERBα mediates circadian sensitivity to mortality in murine vesicular stomatitis virus-induced encephalitis

Khatuna Gagnidze et al. Proc Natl Acad Sci U S A. .

Abstract

Certain components and functions of the immune system, most notably cytokine production and immune cell migration, are under circadian regulation. Such regulation suggests that circadian rhythms may have an effect on disease onset, progression, and resolution. In the vesicular stomatitis virus (VSV)-induced encephalitis model, the replication, caudal penetration, and survivability of intranasally applied VSV depends on both innate and adaptive immune mechanisms. In the current study, we investigated the effect of circadian time of infection on the progression and outcome of VSV-induced encephalitis and demonstrated a significant decrease in the survival rate in mice infected at the start of the rest cycle, zeitgeber time 0 (ZT0). The lower survival rate in these mice was associated with higher levels of circulating chemokine (C-C motif) ligand 2 (CCL2), a greater number of peripherally derived immune cells accumulating in the olfactory bulb (OB), and increased production of proinflammatory cytokines, indicating an immune-mediated pathology. We also found that the acrophase of molecular circadian clock component REV-ERBα mRNA expression in the OB coincides with the start of the active cycle, ZT12, when VSV infection results in a more favorable outcome. This result led us to hypothesize that REV-ERBα may mediate the circadian effect on survival following VSV infection. Blocking REV-ERBα activity before VSV administration resulted in a significant increase in the expression of CCL2 and decreased survival in mice infected at the start of the active cycle. These data demonstrate that REV-ERBα-mediated inhibition of CCL2 expression during viral-induced encephalitis may have a protective effect.

Keywords: circadian; immune response; inflammation; monocytes; vesicular stomatitis virus.


Figures

Fig. 1.
Fig. 1.
Circadian time of infection affects survival following VSV i.n. administration. Two groups of mice were maintained on opposite light–dark cycles. For one group of mice VSV infection (LD50 dose applied i.n.) was done at the start of the light cycle (ZT0), and for the other group i.n. VSV application was done at the start of dark cycle (ZT12). (A) Survival curves are a composite of three independent experiments [total n = 17 per group, log-rank (Mantel–Cox) test, P = 0.004]. (B) Disease progression is expressed as the percent of weight change following VSV infection. Compiled data are expressed as mean ± SEM (total n = 17 per group; Student’s t test, *P < 0.05, **P < 0.01, ***P < 0.001).
Fig. 2.
Fig. 2.
Circadian time of infection affects cytokine and hormone levels following VSV i.n. administration. Blood samples were collected from ZT0 and ZT12 mice under the control (PBS-treated) condition and at the indicated time points following VSV infection. (AC) Circulating cytokine levels were measured using cytometric bead array. Data compiled from two independent experiments are expressed as mean ± SEM (total n = 6 per time point, two-way ANOVA, Bonferroni's posttest; *P < 0.05, **P < 0.01, ZT12 vs. ZT0). (D) Blood CORT levels were measured by RIA. Data compiled from two independent experiments are expressed as mean ± SEM (total n = 6 per time point; two-way ANOVA, Bonferroni's posttest, *P < 0.05, **P < 0.01, ZT12 vs. ZT0; comparison within each circadian group was done using Student’s t test, #P < 0.05, ##P < 0.001 vs. ZT0 acrophase).
Fig. S1.
Fig. S1.
Circulating cytokine levels following VSV i.n. administration. Circulating levels of IL-12p70, IL10, and TNF were measured in the blood samples collected from PBS-treated control mice and VSV-infected mice at the indicated time points. Cytokine levels were measure by cytometric bead array.
Fig. S2.
Fig. S2.
Time course of gene expression in the spleen (A) and lung (B) of VSV-infected mice. Tissue was collected from PBS-treated and VSV-infected mice at the indicated time points. Total RNA was isolated, and transcript levels were measured by qPCR using Taqman gene-expression assays. Data are expressed as mean ± SEM (n = 6–8 per time point; two-way ANOVA followed by Bonferroni's multiple comparison test, **P < 0.01, ***P < 0.001, ZT0 vs. ZT12).
Fig. 3.
Fig. 3.
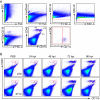
Circadian time of infection affects immune cell populations in the OB of VSV-infected mice. Mice were killed at 96 h following VSV, and OB tissue was processed for flow cytometry analysis. (A) Cells pregated on live/singlets/lin were analyzed based on the expression of CD45 and CD11b. Three distinct populations were detected: CD45int/CD11bhi, CD45hi/CD11bhi, and CD45hi/CD11bint. Compiled data are expressed as mean ± SEM of the percent of parent population (n = 50 for each population; Student’s t test, **P < 0.01, ***P < 0.001, ZT12 vs. ZT0). (BD) CD45/CD11b cell populations were phenotyped using flow cytometry. Only data for ZT0 group are shown because no phenotypic differences were found between the ZT0 and ZT12 groups. Data compiled from two or three independent experiments are expressed as mean ± SEM of geometric mean of fluorescence intensity (MFI) for each antibody (total n = 4–6 per group.)
Fig. S3.
Fig. S3.
Immune cell analysis in VSV-infected mouse OB tissue by flow cytometry. (A) Gating strategy used for FACS and flow cytometry experiments: Cells were gated on live/dead, forward-scatter (FSC) singlets, side-scatter (SSC) singlets, TCRβ/CD19-negative, CD45/CD11b cells. Three cell populations distinguished based on CD45 and CD11b expression (P1, CD45int/CD11bhi; P2, CD45hi/CD11bhi; and P3, CD45hi/CD11bint) were each gated further on CD11c cells. (B) Three cell populations (P1, CD45int/CD11bhi; P2, CD45hi/CD11bhi; and P3, CD45hi/CD11bint) were analyzed by flow cytometry 24–96 hpi in control (PBS-treated) and VSV-infected mouse OB.
Fig. S4.
Fig. S4.
Analysis of CD11c+ and CD11c subpopulations in the OB tissue. Mice were killed 96 h following VSV infection, and OB tissue was processed for flow cytometry analysis. Cells pregated on live/singlets/lin were analyzed based on the expression of CD45/CD11b. (A) The proportion CD11c+ and CD11c subsets was determined within three immune cell populations. Data are expressed as mean ± SEM of the percent of the parent population (total n = 50 for each population; Student’s t test, *P < 0.05, ZT0 vs. ZT12). (B) The phenotype of CD11c+ and CD11c cells was characterized further using a variety of markers characteristic of monocytes and other immunological subsets. Representative histograms for cells isolated from ZT0 and ZT12 mice OB are shown.
Fig. 4.
Fig. 4.
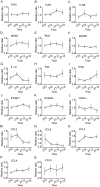
Circadian time of infection affects gene expression in the OB of VSV-infected mice. Total RNA was isolated from OB tissue of VSV-infected mice at the indicated time points. Transcript levels for proinflammatory cytokines (AD); chemokine (E), and chemokine receptor (F) were measured by qPCR. Data compiled from two independent experiments are expressed as mean ± SEM (n = 6–8 per time point; two-way ANOVA, Bonferroni's posttest, *P < 0.05, **P < 0.01, ***P < 0.001, ZT0 vs. ZT12).
Fig. S5.
Fig. S5.
Expression of immune genes in the OB of VSV-infected mice. Total RNA was isolated from OB tissue of VSV-infected mice at the indicated time points. Transcript levels for antiviral cytokine and receptors (AC) and pattern-recognition receptors (DF) were measured by qPCR using Taqman gene-expression assays. Data are expressed as mean ± SEM (n = 68 per time point; two-way ANOVA followed by Bonferroni's multiple comparison test).
Fig. 5.
Fig. 5.
Expression of circadian clock genes in the OB tissue of naive mice. Total RNA was isolated from OB tissue at the indicated time points. Transcript levels for circadian clock genes were measured by qPCR. Data compiled from three independent experiments are expressed as mean ± SEM (total n = 6 per time point; one-way ANOVA, Bonferroni's posttest, *P < 0.05, **P < 0.01, ***P < 0.001 vs. ZT0; ^^P < 0.01, ^^^P < 0.001 vs. ZT6; ##P < 0.01, ###P < 0.001 vs. ZT12).
Fig. S6.
Fig. S6.
Expression of immune genes in the OB tissue of naive mice. Total RNA was isolated from OB tissue at the indicated time points. Transcript levels for pattern-recognition receptors (AF), proinflammatory cytokines (G and H), antiviral cytokine and receptors (IL), and chemokines (MQ) were measured by qPCR using Taqman gene-expression assays. Data are expressed as mean ± SEM and represent a composite of three independent experiments (total n = 6 per time point).
Fig. 6.
Fig. 6.
Inactivation of REV-ERBα during VSV i.n. administration leads to poor survival. Two groups of mice were treated i.n. with either SR8278 (20 µg) or with vehicle solution administered twice: 4 h before and concomitant with VSV infection. (A) Survival curves are a composite of two independent experiments [total n = 13 per group; log-rank (Mantel–Cox) test, *P = 0.047 for ZT12-vehicle vs. ZT12-SR8278). (B) Total RNA was isolated from OB tissue of SR8278- or vehicle-treated mice 12 h after VSV i.n. administration. Transcript levels for CCL2 and IL-6 were measured by qPCR. Data compiled from two independent experiments are expressed as mean ± SEM (total n = 5 per time point; two-way ANOVA, Bonferroni's posttest, *P < 0.05, ZT12-vehicle vs. ZT12-SR8278).
Fig. S7.
Fig. S7.
Effects of SR8278 treatment. (A) Animals treated with SR8278/PBS were monitored for 14 d. Health score is expressed as the percent of weight change following treatment. Data are expressed as mean ± SEM (total n = 3 per group). (B and C) Total RNA was isolated from OB (B) and lung (C) tissue of SR8278- or vehicle-treated mice 12 h after VSV i.n. administration. Transcript levels for the indicated genes were measured by qPCR using Taqman gene-expression assays. Data compiled from two independent experiments are expressed as mean ± SEM (total n = 5 per time point; two-way ANOVA, Bonferroni's posttest, *P < 0.05, ZT0-vehicle vs. ZT0-SR8278).
Fig. 7.
Fig. 7.
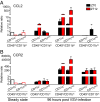
CCL2 and CCR2 expression in OB immune cells. (A and B) CD45int/CD11bhi, CD45hi/CD11bhi, and CD45hi/CD11bint cells isolated from the OB of VSV-infected mice at 96 hpi were FACS sorted based on CD11c expression. The only population present in the OB of untreated mice, CD45int/CD11bhi, was analyzed also (steady state, open bars). Total RNA was isolated, and transcript levels for CCL2 (A) and CCR2 (B) were measured by qPCR. Data compiled from five independent experiments are expressed as mean ± SEM (total n = 5).
Fig. S8.
Fig. S8.
CCL2 expression in the OB. Immunofluorescent labeling was performed on PFA-fixed control (PBS-treated) and VSV-infected OB tissue at 96 hpi. (A) CCL2 labeling of OB immune cells; CCL2 is shown in blue, Iba1 is shown in red, and CD11c-EYFP is shown in green. Arrows indicate cells coexpressing CCL2/IbaI and CD11c-EYFP; arrowheads indicate cells that coexpress only CCL2 and IbaI. (B) CCL2 labeling of astroglia cells; CCL2 is shown in blue, and FGAP is shown in red. Arrows indicate cells colabeled with CCL2 and GFAP. (C) CCL2 labeling of neurons; CCL2 is shown in green, and TUJ-1 is shown in red. Arrows indicate cells colabeled with CCL2 and TUJ-1. White squares denote areas in which a single label is shown. (Scale bars: 25 µm for overlaid panels, 10 µm for single-label panels.)
Fig. S9.
Fig. S9.
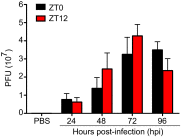
Viral titer in the OB of VSV-infected mice. Total RNA was isolated from OB tissue at the indicated time points, and the VSV glycoprotein transcript was amplified using qPCR. The VSV titer (pfu) was calculated based on a logarithmic standard curve generated with known amounts of purified virus. Data are expressed as mean ± SEM and represent a composite of two independent experiments (total n = 4–5 per time point).

Similar articles

Cited by

References

    1. Curtis AM, Bellet MM, Sassone-Corsi P, O’Neill LAJ. Circadian clock proteins and immunity. Immunity. 2014;40(2):178–186. - PubMed
    1. Silver AC, Arjona A, Hughes ME, Nitabach MN, Fikrig E. Circadian expression of clock genes in mouse macrophages, dendritic cells, and B cells. Brain Behav Immun. 2012;26(3):407–413. - PMC - PubMed
    1. Fonken LK, et al. Microglia inflammatory responses are controlled by an intrinsic circadian clock. Brain Behav Immun. 2015;45:171–179. - PMC - PubMed
    1. Silver AC, Arjona A, Walker WE, Fikrig E. The circadian clock controls toll-like receptor 9-mediated innate and adaptive immunity. Immunity. 2012;36(2):251–261. - PMC - PubMed
    1. Sato S, et al. A circadian clock gene, Rev-erbα, modulates the inflammatory function of macrophages through the negative regulation of Ccl2 expression. J Immunol. 2014;192(1):407–417. - PubMed

Publication types