. 2016 May 17;113(20):5592-7.
doi: 10.1073/pnas.1604721113. Epub 2016 May 3.

Glycolipid GD3 and GD3 synthase are key drivers for glioblastoma stem cells and tumorigenicity

Affiliations

Glycolipid GD3 and GD3 synthase are key drivers for glioblastoma stem cells and tumorigenicity

Shih-Chi Yeh et al. Proc Natl Acad Sci U S A. .

Abstract

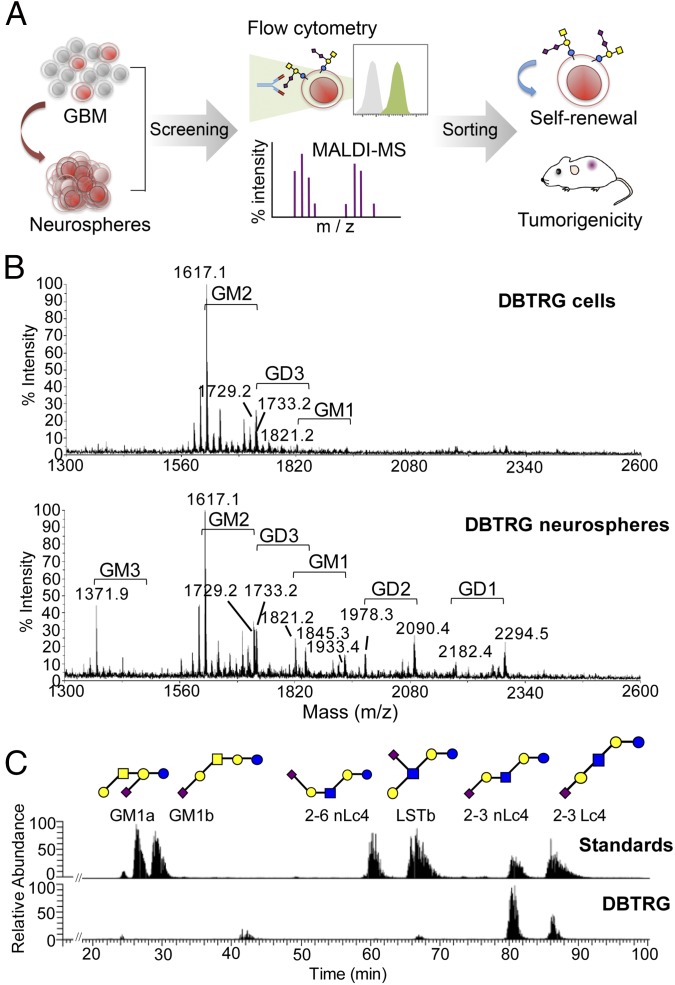
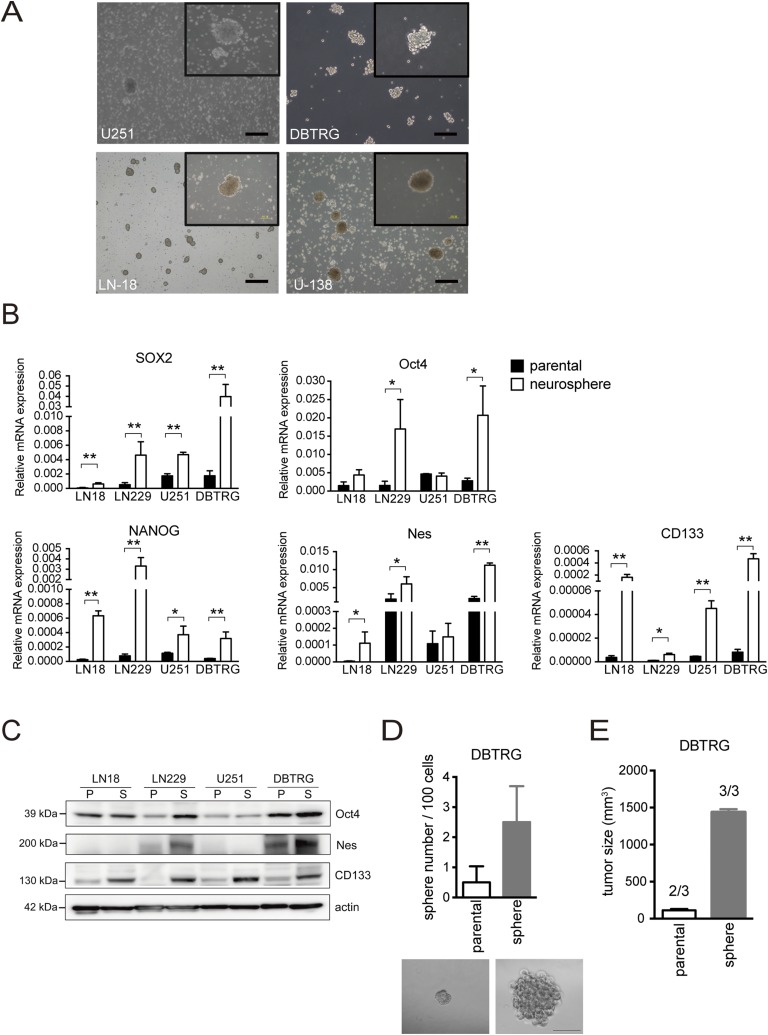
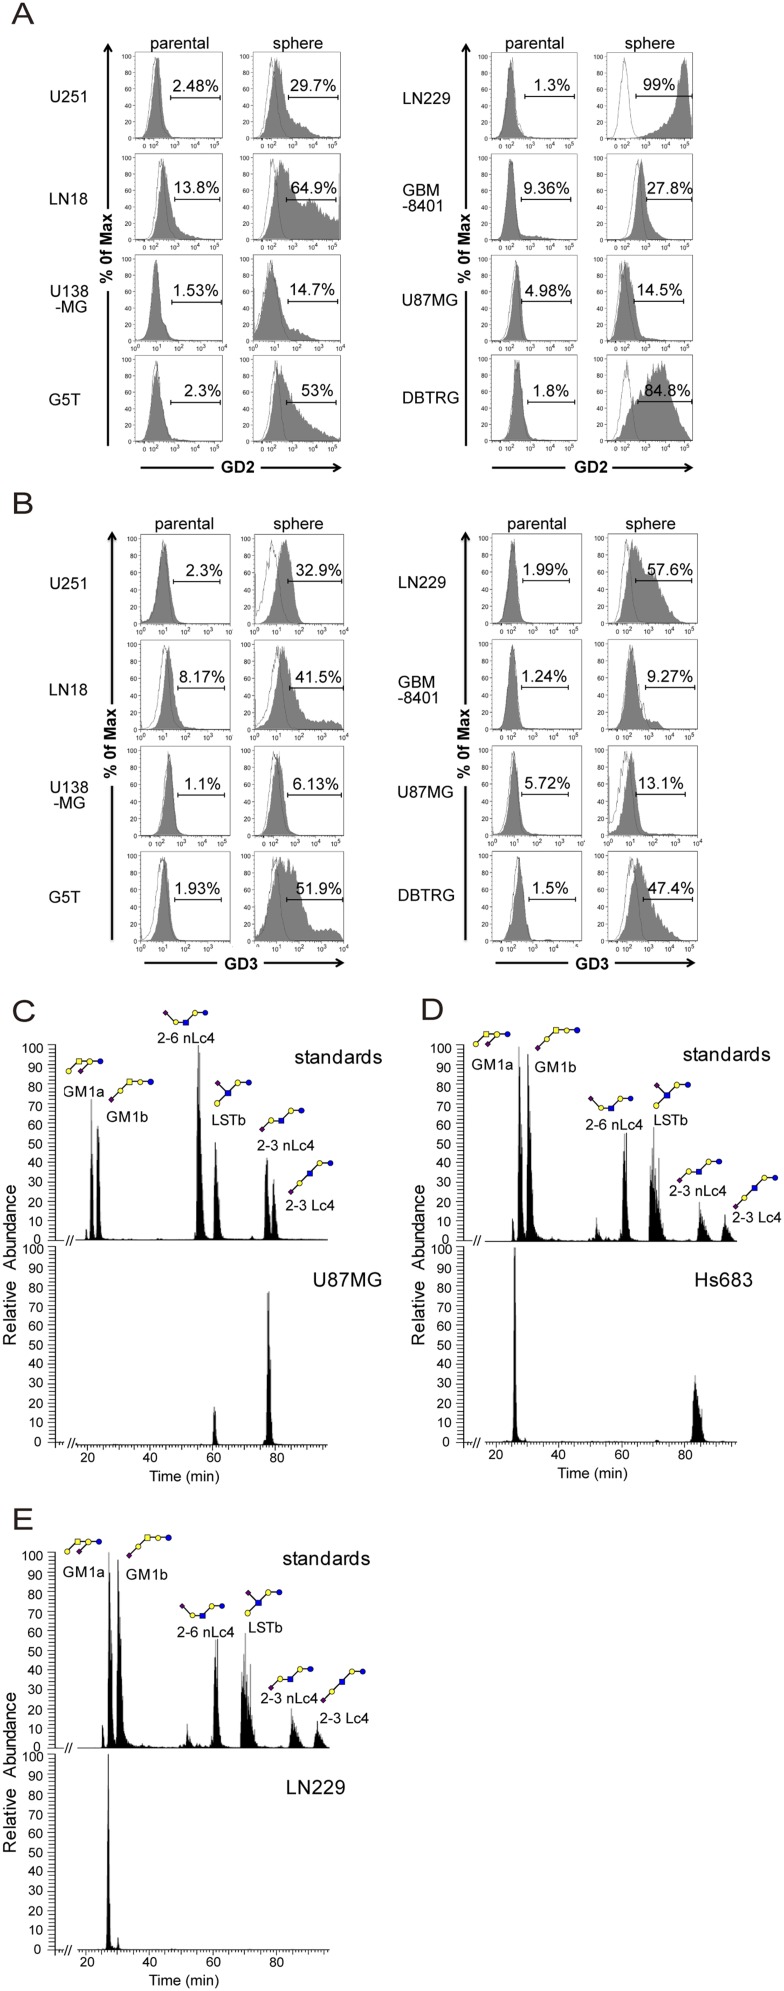
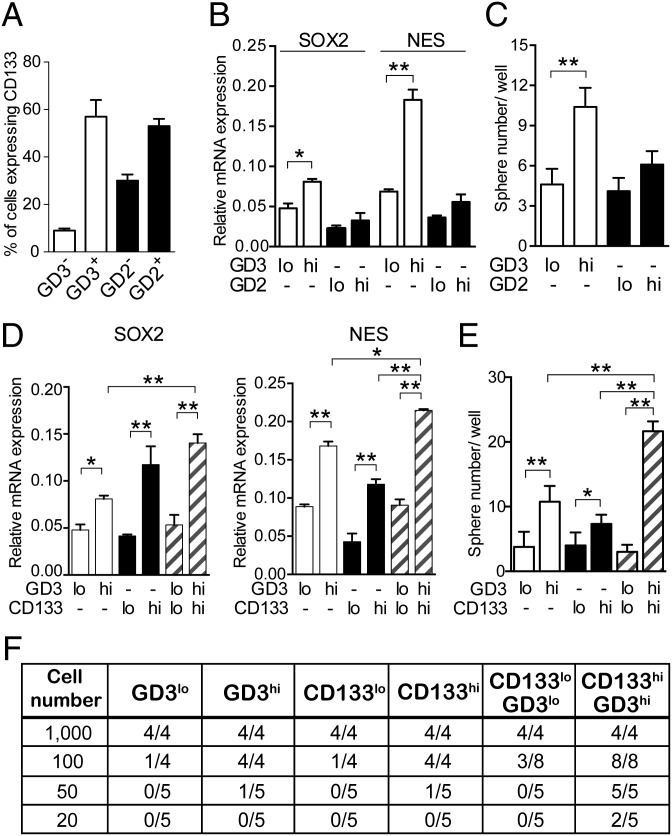
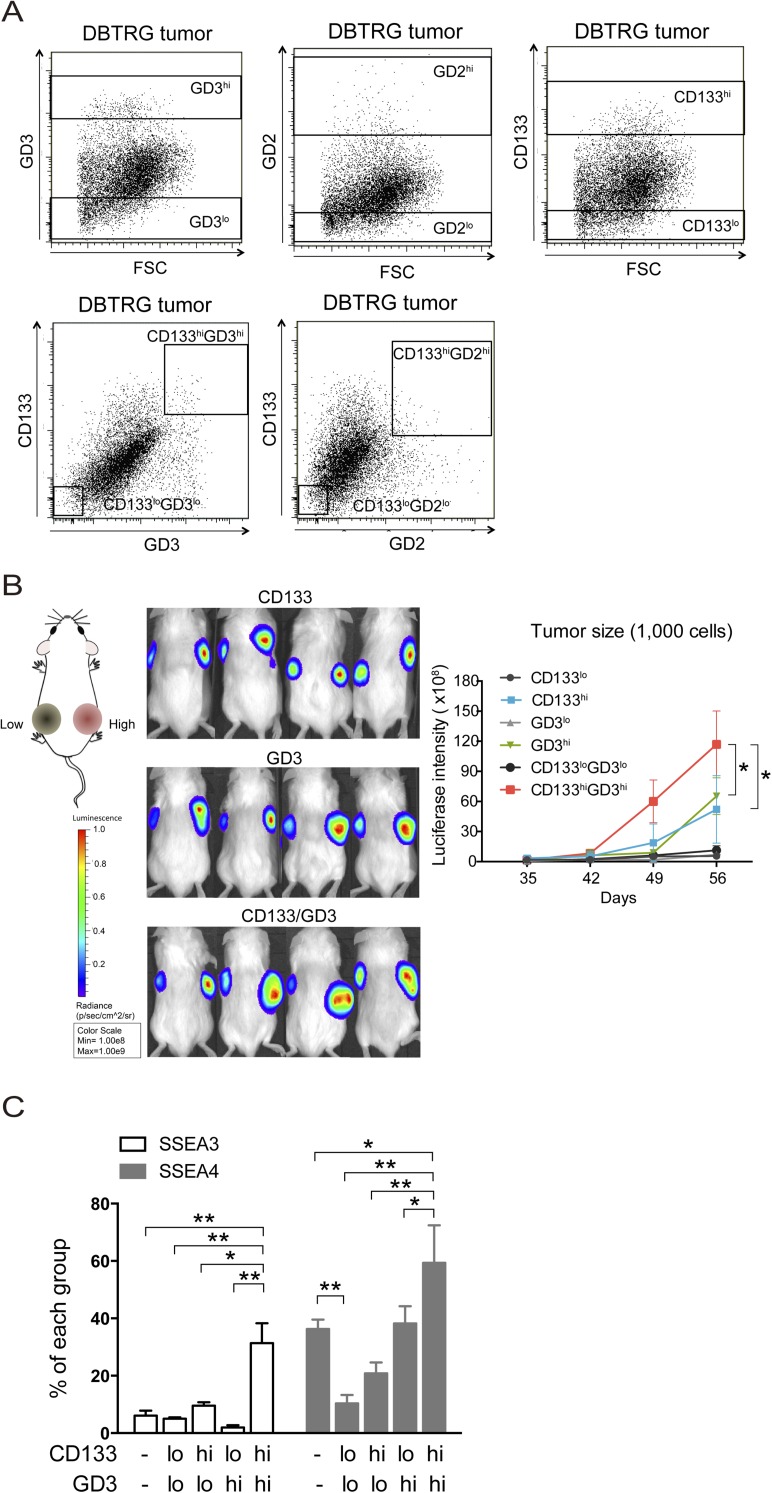
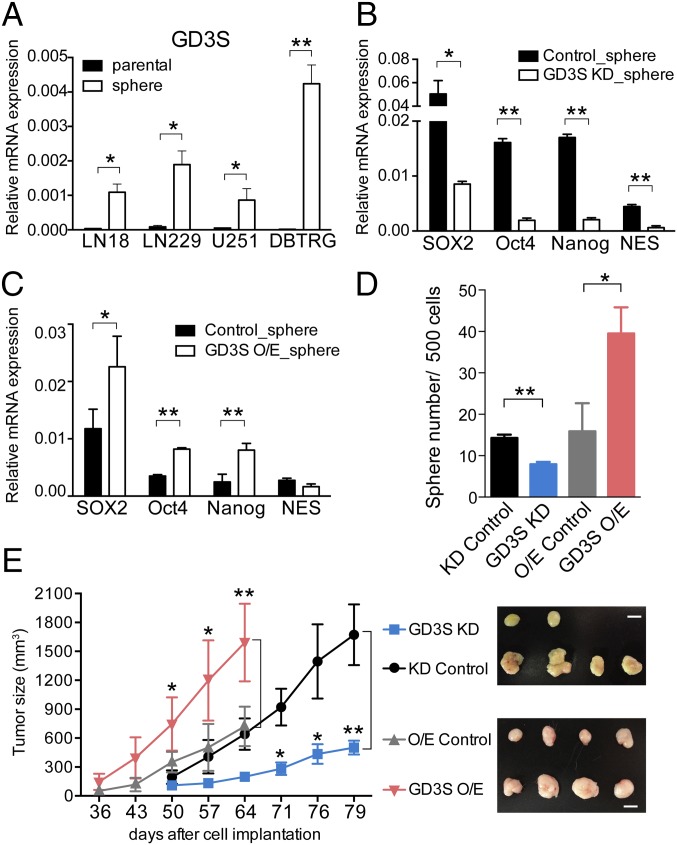
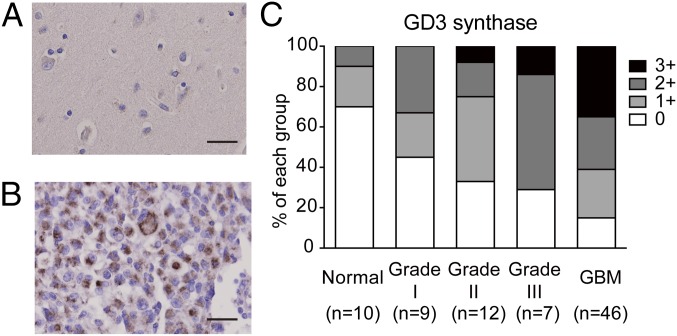
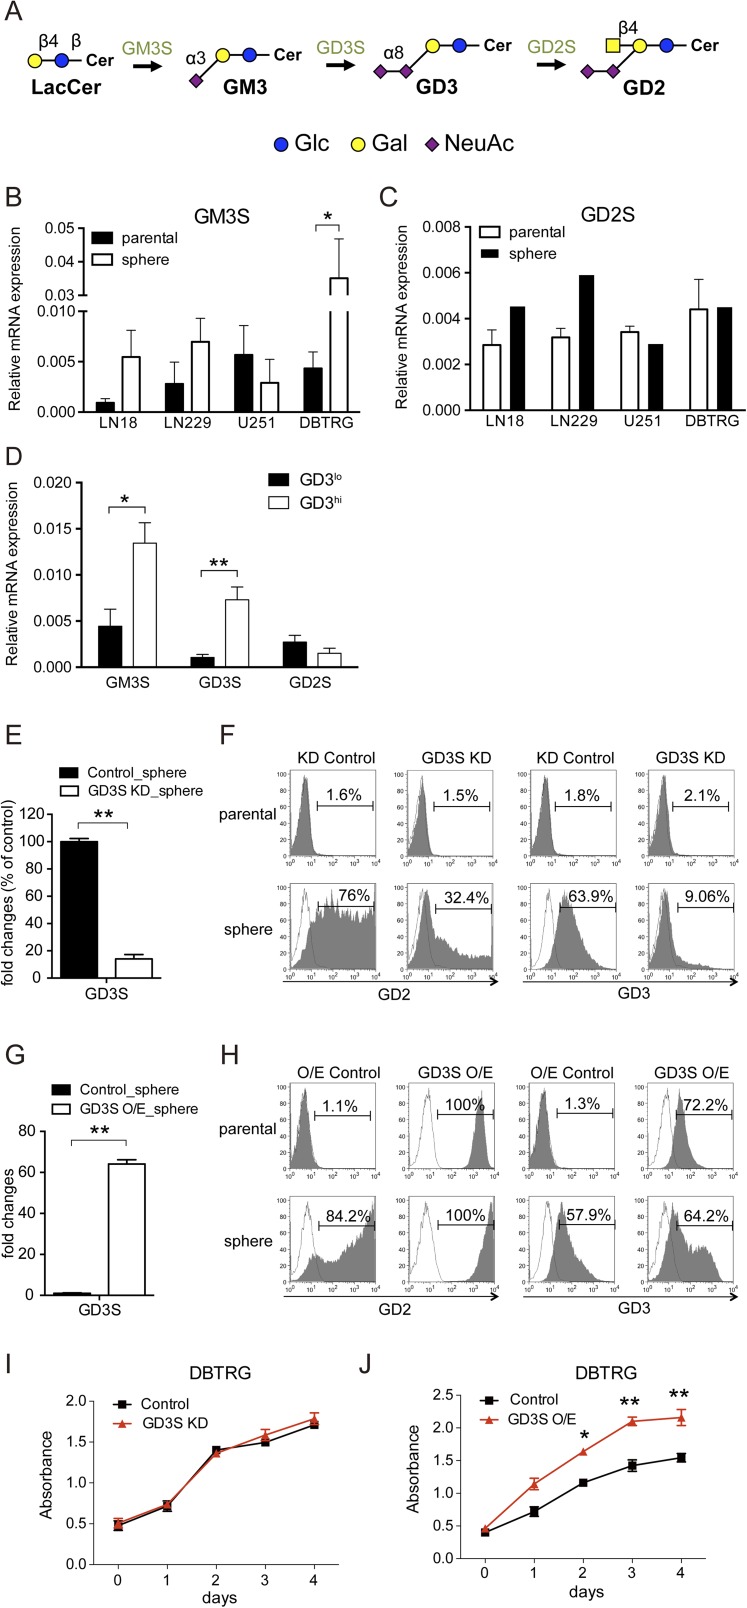
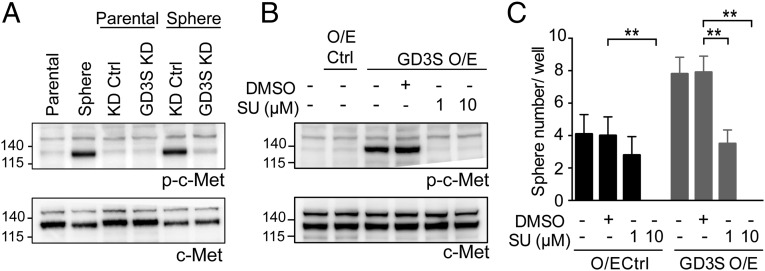
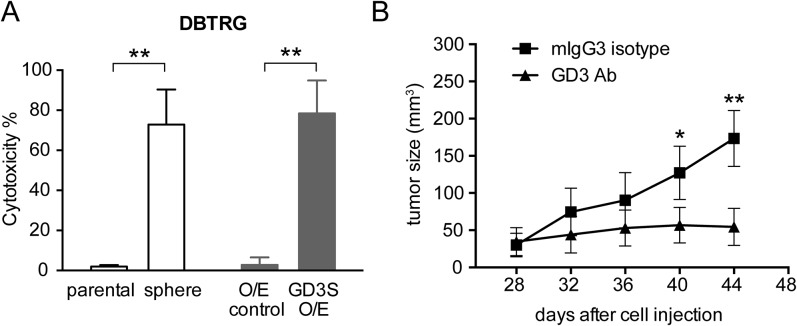
The cancer stem cells (CSCs) of glioblastoma multiforme (GBM), a grade IV astrocytoma, have been enriched by the expressed marker CD133. However, recent studies have shown that CD133(-) cells also possess tumor-initiating potential. By analysis of gangliosides on various cells, we show that ganglioside D3 (GD3) is overexpressed on eight neurospheres and tumor cells; in combination with CD133, the sorted cells exhibit a higher expression of stemness genes and self-renewal potential; and as few as six cells will form neurospheres and 20-30 cells will grow tumor in mice. Furthermore, GD3 synthase (GD3S) is increased in neurospheres and human GBM tissues, but not in normal brain tissues, and suppression of GD3S results in decreased GBM stem cell (GSC)-associated properties. In addition, a GD3 antibody is shown to induce complement-dependent cytotoxicity against cells expressing GD3 and inhibition of GBM tumor growth in vivo. Our results demonstrate that GD3 and GD3S are highly expressed in GSCs, play a key role in glioblastoma tumorigenicity, and are potential therapeutic targets against GBM.

Keywords: GBM; ST8SIA1; cancer stem cells; gangliosides; glycosphingolipids.


Conflict of interest statement

The authors declare no conflict of interest.

Figures

Fig. 1.
Fig. 1.
Profiling and discovery of glycan markers for GBM stem cells. (A) Glycan-related molecules specifically expressed in GBM neurospheres (stem-like cells) were screened and verified by flow cytometry and MS, respectively. The cells carrying these specific glycan markers were enriched from GBM xenograft tumors and further examined for their abilities of self-renewal and tumorigenicity in vivo. (B) Extracted gangliosides from DBTRG cells and neurospheres were permethylated and analyzed by MALDI-MS. The major ganglioside in DBTRG cells was GM2 (m/z = 1,617.0), whereas the most predominant complex gangliosides in DBTRG neurospheres were GM3 (m/z = 1,371.9), GM2 (m/z = 1,617.1), GM1 (m/z = 1,821.2), GD1 (m/z = 2,294.5), GD3 (m/z = 1,733.2), and GD2 (m/z = 2,090.4). Gangliosides with the same glycan moiety but with different fatty acyl contents are bracketed. (C) Isomeric structures of GM1 in DBTRG cells were separated by a porous graphitized carbon LC-MS–based platform. The major gangliosides include 2-3 sialyl lactotetraose (Lc4) (21.4%), 2-3 sialyl neolactotetraose (nLc4) (70.6%), and a small amount of sialyl-lacto-N-tetraose b (LSTb) (4%) and GM1a (4%). Monosaccharide symbols were used as follows: yellow circle, galactose; blue circle, glucose; yellow square, N-acetylgalactosamine; blue square, N-acetylglucosamine; purple diamond, N-acetylneuraminic acid.
Fig. S1.
Fig. S1.
Characteristics of GSCs in an established neurosphere culture system. (A) Morphology of neurospheres was observed in four GBM cells. (Magnification: Inset, 100×. Scale bars, 100 μm.) (B) mRNA expression levels of SOX2, Oct4, NANOG, NES, and CD133 were examined by Q-PCR. Data are the mean ± SD of three independent experiments. (C) Protein expression of Oct4, NES, and CD133 was detected by Western blotting. P, parental cells; S, neurosphere. (D) Ability of self-renewal was evaluated by neurosphere formation. (Scale bar, 100 μm.) The mean ± SD for each group (n = 10) is shown. (E) Tumor growth and tumor initiation ratio for 10,000 parental cells and neurospheres were assayed in immunodeficient mice (n = 3 mice per group). The P value between groups was determined by an unpaired Student’s t test. *P < 0.05; **P < 0.01.
Fig. S2.
Fig. S2.
GD3 and GD2 expression analysis by flow cytometry and GM1 isomer analysis by porous graphitized carbon LC-MS. (A and B) GBM parental cells and neurospheres were stained with GD3 or GD2 antibody, and the staining intensity was analyzed by flow cytometry. The histograms of the cells stained with GD3 (or GD2) and isotype control are shown in gray and white, respectively. (C) GM1 isomers of U87 cells were mainly composed of 2-3 sialyl neolactotetraose (nLc4) (87%) and sialyl-lacto-N-tetraose b (LSTb) (13%). (D) GM1 isomers of Hs683 cells consisted of 2-3 sialyl nLc4 (75%) and GM1a (25%). (E) The only GM1 isomer expressed on LN229 cells was GM1a. Monosaccharide symbols were used as follows: yellow circle, galactose; blue circle, glucose; yellow square, N-acetylgalactosamine; blue square, N-acetylglucosamine; purple diamond, N-acetylneuraminic acid.
Fig. 2.
Fig. 2.
GD3 identifies GSCs in GBM tumors. (A) DBTRG tumor cells were costained with anti-GD2, anti-GD3, and anti-CD133 antibodies. We calculated the percentage of cells expressing CD133 in GD2+, GD2, GD3+, or GD3 cells. (B) Expression levels of SOX2 and NES were examined in sorted cells by quantitative PCR (Q-PCR). Results are shown as mean ± SD (n = 3). (C) Sphere formation assays were performed in sorted cells. The mean ± SD for each group (n = 10) is shown. (D) Q-PCR analyses of stemness genes were performed in tumor cells sorted by the indicated molecules. Results are shown as mean ± SD (n = 3). (E) Self-renewal potential of each subpopulation from DBTRG tumors was evaluated in neurosphere formation assays. Cells seeded at a density of 100 cells per well were represented, and data are shown as mean ± SD (n = 10). (F) In vivo limiting dilution assay of separated subpopulations derived from xenograft tumors was conducted in mice. The numbers of tumor cell-injected mice and tumor-bearing mice are shown (20–1,000 cells per mouse, n = 4 or n = 5 mice per group). The P value was determined by an unpaired Student’s t test between groups (B and C) and by one-way ANOVA for multiple comparisons (D and E). *P < 0.05; **P < 0.01.
Fig. S3.
Fig. S3.
Expression levels of various markers in tumor cells and the tumor growth of 1,000 cells carrying GD3 and CD133 markers. (A) Expression levels of GD3, GD2, and CD133 of DBTRG tumor cells are displayed in a dot blot. The rectangle indicates the sorting area for different molecules. (B) One thousand cells expressing firefly luciferase and the indicated low or high levels of CD133, GD3, and CD133/GD3 were injected into the left or right flanks of nonobese diabetic-scid IL2rγnull mice, respectively, and tumor growth was monitored by bioluminescence imaging (BLI) from 35 to 56 d. (Left) Graphical representation is the BLI intensity for mice injected with the indicated cells at 56 d. Data are the mean ± SD of tumors in four mice. (C) DBTRG tumor cells were costained with anti-SSEA3 (or anti-SSEA4), anti-GD3, and anti-CD133 antibodies. We calculated the percentage of cells expressing SSEA3 or SSEA4 in separated CD133 and GD3 cells. The mean ± SD for each group (n = 3) is shown. All P values between groups were determined by one-way ANOVA. *P < 0.05; **P < 0.01.
Fig. 3.
Fig. 3.
Manipulation of GD3S mediates stemness genes, sphere formation, and tumor initiation. (A) The expression level of GD3S in DBTRG parental cells and neurospheres was measured by Q-PCR. (B and C) The expression levels of stemness genes were determined in neurospheres that expressed vector control, GD3S KD (B), or GD3S O/E (C) plasmid. Results are shown as mean ± SD (n = 3). (D) Neurosphere formation assays using vector control, GD3S KD, or GD3S O/E cells were performed in 96 wells. The mean ± SD for each group (n = 10) is shown. (E) Tumor growth generated from 105 vector control, GD3S KD, or GD3S O/E cells was monitored using a caliper to measure the tumor size every 4 d between 8 and 12 wk (n = 4 mice per group). (Right) Gross view of isolated tumors. (Scale bars, 1 cm.) The P value between groups was determined by an unpaired Student’s t test. *P < 0.05; **P < 0.01.
Fig. 4.
Fig. 4.
Expression of GD3S in GBM tissues. Representative images of normal brain tissues (A) and GBM (B) after immunohistochemical staining. (Scale bars, 20 μm.) (C) Statistical results of GD3S immunohistochemistry. Grade I (n = 9), grade II (n = 12), grade III (n = 7), grade IV (GBM, n = 46), and normal brain tissues (n = 10) were counterstained with hematoxylin after immunohistochemistry. The staining intensity of the tissues was scored as 0 (negative), 1+ (weak), 2+ (moderate), and 3+ (strong).
Fig. S4.
Fig. S4.
GD3S-mediated GD3 expression, stemness genes, and cell growth. (A) Schematic diagram of the biosynthesis of a part of the ganglioseries GSLs. GM3, the precursor of GD3, is synthesized from lactosylceramide. Graphic notations are labeled. Gal, galactose; Glc, glucose; NeuAc, N-acetylneuraminic acid. (B and C) Measurement of the mRNA expression of GM3S and GD2S in DBTRG parental cells and neurospheres by Q-PCR. (D) Expression levels of glycosyltransferases in separated GD3hi and GD3lo cells of DBTRG tumors. (E) To measure the efficiency of GD3S KD in neurospheres, mRNA expression was analyzed by Q-PCR. (F) GD2 and GD3 levels in GD3S KD and vector control cells were analyzed by FACSCanto flow cytometry. The histograms of the cells stained with GD3 (or GD2) and isotype controls are shown in gray and white, respectively. (G) To measure the efficiency of GD3S O/E in neurospheres, mRNA expressions were analyzed by Q-PCR. (H) Same method as in E was performed in GD3S O/E and vector control cells. (I and J) Four thousand cells per well were seeded in several 96-well plates, and the cell numbers were measured by WST-1 at the indicated time for cell proliferations of GD3S KD, GD3S O/E, and vector control cells. Data are the mean ± SD (BE, G, I, and J) of three independent experiments. The P value between groups was determined by an unpaired Student’s t test. *P < 0.05; **P < 0.01.
Fig. 5.
Fig. 5.
GD3S regulates sphere formation through activation of c-Met signaling. (A) Western blot analysis of p-c-Met and c-Met expression in DBTRG parental cells, neurospheres, and both of them transfected with KD control and GD3S KD plasmid. (B) Expression of p-c-Met and c-Met in DBTRG GD3S O/E cells treated with or without SU11274. (C) SU11274 treatment in DBTRG O/E control and DBTRG GD3S O/E cells was used for sphere formation assay. The mean ± SD for each group (n = 10) is shown. The P value was obtained by one-way ANOVA. Ctrl, control; SU, SU11274. *P < 0.05; **P < 0.01.
Fig. S5.
Fig. S5.
GD3 antibody suppresses GBM cell and tumor growth. (A) DBTRG cells, neurospheres, O/E control, and GD3S O/E cells were treated with 20 μg/mL R24 and rabbit complement to observe R24-induced cell lysis. The mean ± SD for each group (n = 10) is shown. (B) Nude mice were inoculated with DBTRG cells in the right flank, and R24 or mouse IgG3 isotype control (150 μg per dose) was administered i.p. at days 28, 32, 36, and 40. The tumor volume in each group (n = 5–7) was measured at different time points and is shown as the mean ± SD. The P value between groups was determined by an unpaired Student’s t test. *P < 0.05; **P < 0.01.

Similar articles

Cited by

References

    1. Wen PY, Kesari S. Malignant gliomas in adults. N Engl J Med. 2008;359(5):492–507. - PubMed
    1. Sanai N, Alvarez-Buylla A, Berger MS. Neural stem cells and the origin of gliomas. N Engl J Med. 2005;353(8):811–822. - PubMed
    1. Reya T, Morrison SJ, Clarke MF, Weissman IL. Stem cells, cancer, and cancer stem cells. Nature. 2001;414(6859):105–111. - PubMed
    1. Visvader JE, Lindeman GJ. Cancer stem cells in solid tumours: Accumulating evidence and unresolved questions. Nat Rev Cancer. 2008;8(10):755–768. - PubMed
    1. Singh SK, et al. Identification of human brain tumour initiating cells. Nature. 2004;432(7015):396–401. - PubMed

Publication types