

High-fat diet-induced obesity Rat model: a comparison between Wistar and Sprague-Dawley Rat
- PMID: 27144092
- PMCID: PMC4836488
- DOI: 10.1080/21623945.2015.1061723
High-fat diet-induced obesity Rat model: a comparison between Wistar and Sprague-Dawley Rat
Abstract
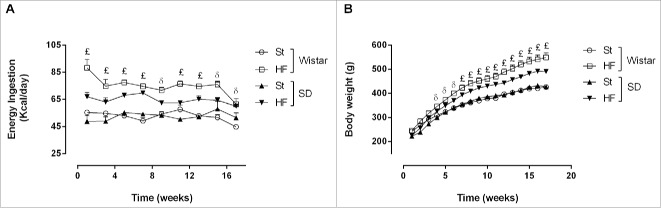
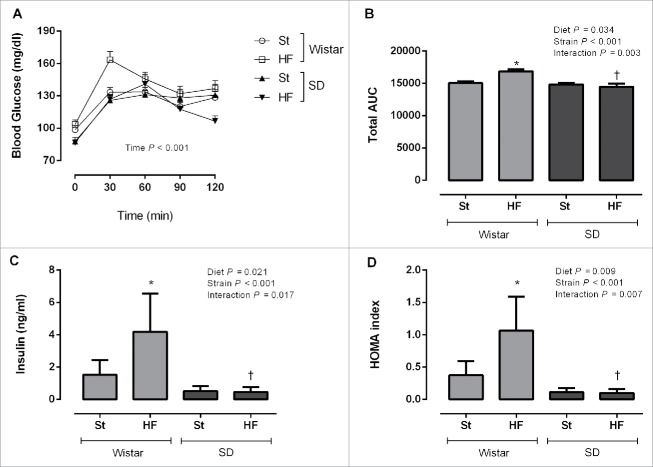
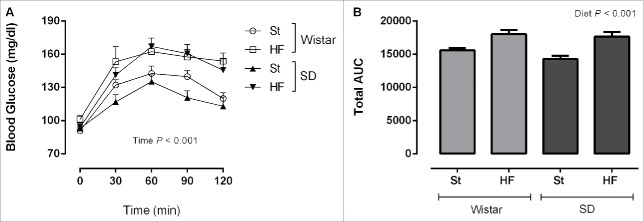
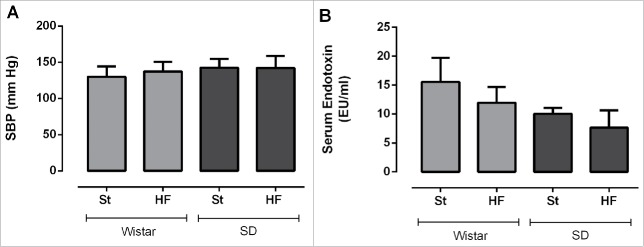
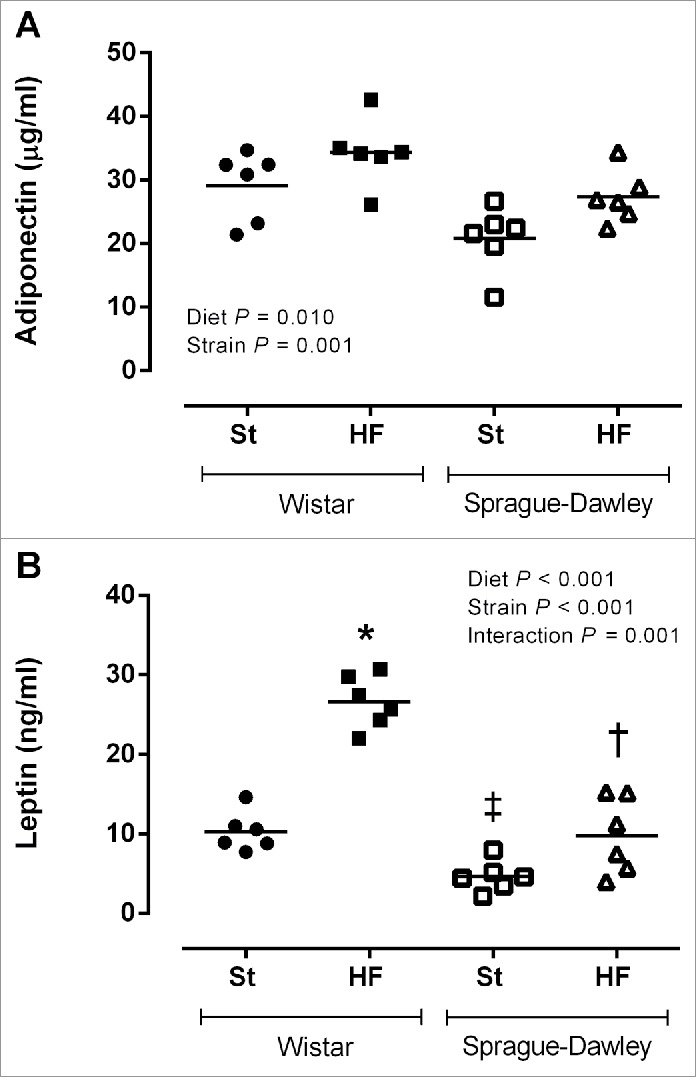
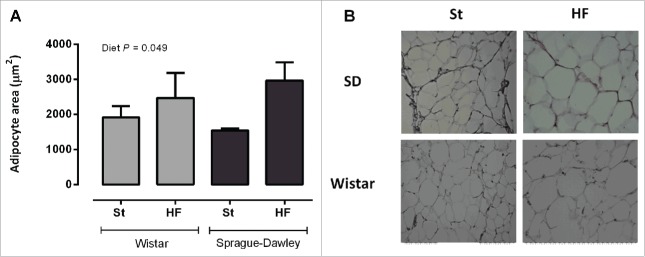
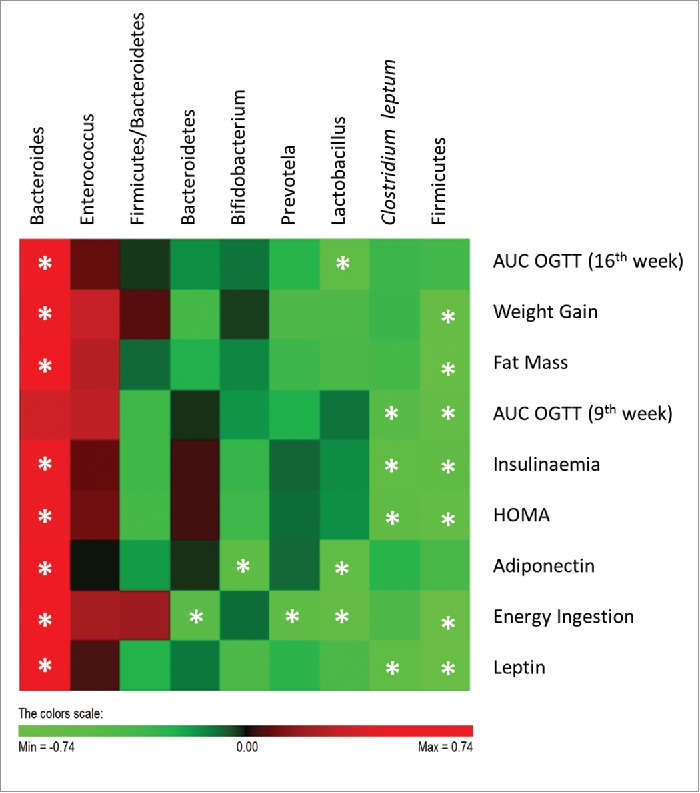
In the past decades, obesity and associated metabolic complications have reached epidemic proportions. For the study of these pathologies, a number of animal models have been developed. However, a direct comparison between Wistar and Sprague-Dawley (SD) Rat as models of high-fat (HF) diet-induced obesity has not been adequately evaluated so far. Wistar and SD rats were assigned for 2 experimental groups for 17 weeks: standard (St) and high-fat (HF) diet groups. To assess some of the features of the metabolic syndrome, oral glucose tolerance tests, systolic blood pressure measurements and blood biochemical analysis were performed throughout the study. The gut microbiota composition of the animals of each group was evaluated at the end of the study by real-time PCR. HF diet increased weight gain, body fat mass, mesenteric adipocyte's size, adiponectin and leptin plasma levels and decreased oral glucose tolerance in both Wistar and SD rats. However, the majority of these effects were more pronounced or earlier detected in Wistar rats. The gut microbiota of SD rats was less abundant in Bacteroides and Prevotella but richer in Bifidobacterium and Lactobacillus comparatively to the gut microbiota of Wistar rats. Nevertheless, the modulation of the gut microbiota by HF diet was similar in both strains, except for Clostridium leptum that was only reduced in Wistar rats fed with HF diet. In conclusion, both Wistar and SD Rat can be used as models of HF diet-induced obesity although the metabolic effects caused by HF diet seemed to be more pronounced in Wistar Rat. Differences in the gut microbial ecology may account for the worsened metabolic scenario observed in Wistar Rat.
Keywords: animal models; diet-induced obesity; high-fat diet; metabolic syndrome; microbiota; obesity.
Figures
References
-
- Alberti KG, Eckel RH, Grundy SM, Zimmet PZ, Cleeman JI, Donato KA, Fruchart JC, James WP, Loria CM, Smith SC Jr.. Harmonizing the metabolic syndrome: a joint interim statement of the International Diabetes Federation Task Force on Epidemiology and Prevention; National Heart, Lung, and Blood Institute; American Heart Association; World Heart Federation; International Atherosclerosis Society; and International Association for the Study of Obesity. Circulation 2009; 120:1640-5; PMID:19805654; http://dx.doi.org/ 10.1161/CIRCULATIONAHA.109.192644 - DOI - PubMed
-
- Ng M, Fleming T, Robinson M, Thomson B, Graetz N, Margono C, Mullany EC, Biryukov S, Abbafati C, Abera SF, et al.. Global, regional, and national prevalence of overweight and obesity in children and adults during 1980-2013: a systematic analysis for the Global Burden of Disease Study 2013. Lancet 2014; 384:766-81; PMID:24880830; http://dx.doi.org/ 10.1016/S0140-6736(14)60460-8 - DOI - PMC - PubMed
-
- Panchal SK, Brown L. Rodent models for metabolic syndrome research. J Biomed Biotech 2011; 2011:351982; PMID:21253582; http://dx.doi.org/ 10.1155/2011/351982 - DOI - PMC - PubMed
-
- Nilsson C, Raun K, Yan FF, Larsen MO, Tang-Christensen M. Laboratory animals as surrogate models of human obesity. Acta Pharmacol Sinica 2012; 33:173-81; PMID:22301857; http://dx.doi.org/ 10.1038/aps.2011.203 - DOI - PMC - PubMed
-
- Malik VS, Willett WC, Hu FB. Global obesity: trends, risk factors and policy implications. Nat Rev Endocrinol 2013; 9:13-27; PMID:23165161; http://dx.doi.org/ 10.1038/nrendo.2012.199 - DOI - PubMed
LinkOut - more resources
Full Text Sources
Other Literature Sources
Molecular Biology Databases
Research Materials
Miscellaneous