Computed tomography-measured adipose tissue attenuation and area both predict adipocyte size and cardiometabolic risk in women
- PMID: 27144095
- PMCID: PMC4836459
- DOI: 10.1080/21623945.2015.1106057
Computed tomography-measured adipose tissue attenuation and area both predict adipocyte size and cardiometabolic risk in women
Abstract
Objective: To assess the ability of CT-derived measurements including adipose tissue attenuation and area to predict fat cell hypertrophy and related cardiometabolic risk.
Methods: Abdominal adipose tissue areas and radiologic attenuation were assessed using 4 CT images in 241 women (age: 47 years, BMI: 26.5 kg/m(2)). Fat cell weight was measured in paired VAT and SAT samples. Fasting plasma lipids, glucose and insulin levels were measured.
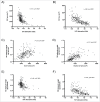
Results: Adipose tissue attenuation was negatively correlated with SAT (r=-0.46) and VAT (r=-0.67) fat cell weight in the corresponding depot (p<0.0001 for both). Women with visceral adipocyte hypertrophy had higher total-, VLDL-, LDL- and HDL-triglyceride and apoB levels as well as a higher cholesterol/HDL-cholesterol ratio, fasting glucose and insulin levels compared to women with smaller visceral adipocytes. Adjustment for VAT area minimized these differences while subsequent adjustment for attenuation eliminated all differences, with the exception of fasting glycaemia. In SAT, adjustment for VAT area and attenuation eliminated all adipocyte hypertrophy-related alterations except for fasting hyperglycaemia.
Conclusion: CT-derived adipose tissue attenuation and area both contribute to explain variation in the cardiometabolic risk profile associated with the same biological parameter: visceral fat cell hypertrophy.
Keywords: adipose tissue radiologic attenuation; computed tomography; omental adipocytes; visceral fat; women.
Figures


Similar articles
-
Fat depot-specific impact of visceral obesity on adipocyte adiponectin release in women.Obesity (Silver Spring). 2009 Mar;17(3):424-30. doi: 10.1038/oby.2008.555. Epub 2008 Dec 11. Obesity (Silver Spring). 2009. PMID: 19219061
-
Contributions of total body fat, abdominal subcutaneous adipose tissue compartments, and visceral adipose tissue to the metabolic complications of obesity.Metabolism. 2001 Apr;50(4):425-35. doi: 10.1053/meta.2001.21693. Metabolism. 2001. PMID: 11288037 Clinical Trial.
-
Associations between breast adipose tissue, body fat distribution and cardiometabolic risk in women: cross-sectional data and weight-loss intervention.Eur J Clin Nutr. 2011 Jul;65(7):784-90. doi: 10.1038/ejcn.2011.35. Epub 2011 Mar 23. Eur J Clin Nutr. 2011. PMID: 21427743 Clinical Trial.
-
Abdominal adipocyte populations in women with visceral obesity.Eur J Endocrinol. 2016 Feb;174(2):227-39. doi: 10.1530/EJE-15-0822. Epub 2015 Nov 17. Eur J Endocrinol. 2016. PMID: 26578637
-
Association of abdominal fat distribution and cardiometabolic risk factors among obese Korean adolescents.Diabetes Metab. 2008 Apr;34(2):126-30. doi: 10.1016/j.diabet.2007.10.012. Epub 2008 Mar 4. Diabetes Metab. 2008. PMID: 18289908
Cited by
-
Breast adipose tissue attenuation as a novel imaging biomarker for cardiometabolic risk.Acta Radiol. 2024 Feb;65(2):167-172. doi: 10.1177/02841851221146267. Epub 2022 Dec 22. Acta Radiol. 2024. PMID: 36560894 Free PMC article.
-
Body composition metrics as a determinant of trastuzumab deruxtecan related toxicity and response.NPJ Breast Cancer. 2025 Apr 25;11(1):38. doi: 10.1038/s41523-025-00754-7. NPJ Breast Cancer. 2025. PMID: 40281028 Free PMC article.
-
Dosimetric effect of body contour changes for prostate and head and neck volumetric modulated arc therapy plans.J Appl Clin Med Phys. 2019 Apr;20(4):115-124. doi: 10.1002/acm2.12571. Epub 2019 Mar 29. J Appl Clin Med Phys. 2019. PMID: 30927323 Free PMC article.
-
Influence of Contrast Administration on Computed Tomography-Based Analysis of Visceral Adipose and Skeletal Muscle Tissue in Clear Cell Renal Cell Carcinoma.JPEN J Parenter Enteral Nutr. 2018 Sep;42(7):1148-1155. doi: 10.1002/jpen.1067. Epub 2018 Jan 19. JPEN J Parenter Enteral Nutr. 2018. PMID: 29350403 Free PMC article.
-
Long-lasting alterations in adipose tissue density and adiponectin production in people living with HIV after thymidine analogues exposure.BMC Infect Dis. 2019 Aug 9;19(1):708. doi: 10.1186/s12879-019-4347-y. BMC Infect Dis. 2019. PMID: 31399063 Free PMC article.
References
-
- Tchernof A, Despres JP. Pathophysiology of human visceral obesity: an update. Physiol Rev 2013; 93:359-404; http://dx.doi.org/10.1152/physrev.00033.2011 - DOI - PubMed
-
- Sun K, Kusminski CM, Scherer PE. Adipose tissue remodeling and obesity. J Clin Invest 2011; 121:2094-101; PMID:21633177; http://dx.doi.org/10.1172/JCI45887 - DOI - PMC - PubMed
-
- Arner E, Westermark PO, Spalding KL, Britton T, Ryden M, Frisen J, Bernard S, Arner P. Adipocyte turnover: relevance to human adipose tissue morphology. Diabetes 2010; 59:105-9; PMID:19846802; http://dx.doi.org/10.2337/db09-0942 - DOI - PMC - PubMed
-
- Veilleux A, Caron-Jobin M, Noel S, Laberge PY, Tchernof A. Visceral adipocyte hypertrophy is associated with dyslipidemia independent of body composition and fat distribution in women. Diabetes 2011; 60:1504-11; PMID:21421806; http://dx.doi.org/10.2337/db10-1039 - DOI - PMC - PubMed
-
- Michaud A, Boulet MM, Veilleux A, Noel S, Paris G, Tchernof A. Abdominal subcutaneous and omental adipocyte morphology and its relation to gene expression, lipolysis and adipocytokine levels in women. Metabolism 2014; 63:372-81; http://dx.doi.org/10.1016/j.metabol.2013.11.007 - DOI - PubMed
LinkOut - more resources
Full Text Sources
Other Literature Sources
Research Materials
Miscellaneous
