. 2016 May 4;12(5):e1006018.
doi: 10.1371/journal.pgen.1006018. eCollection 2016 May.

An FGF3-BMP Signaling Axis Regulates Caudal Neural Tube Closure, Neural Crest Specification and Anterior-Posterior Axis Extension

Affiliations

An FGF3-BMP Signaling Axis Regulates Caudal Neural Tube Closure, Neural Crest Specification and Anterior-Posterior Axis Extension

Matthew J Anderson et al. PLoS Genet. .

Abstract

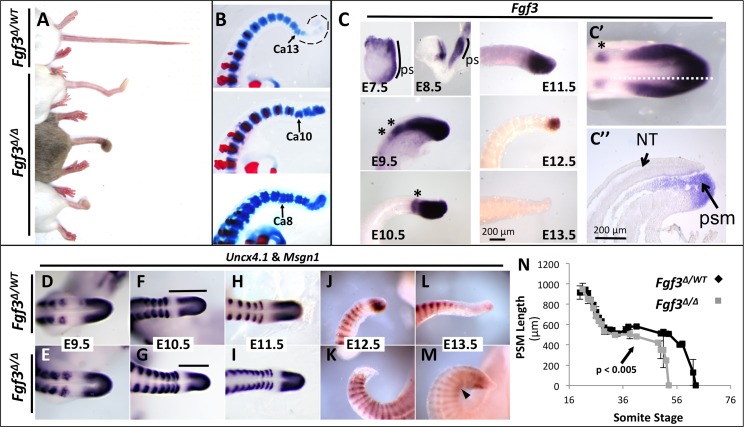
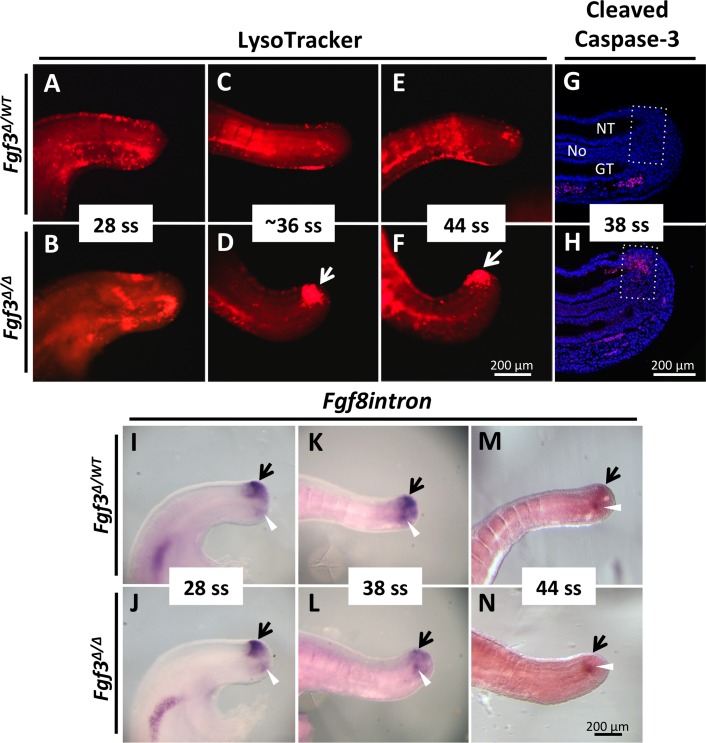
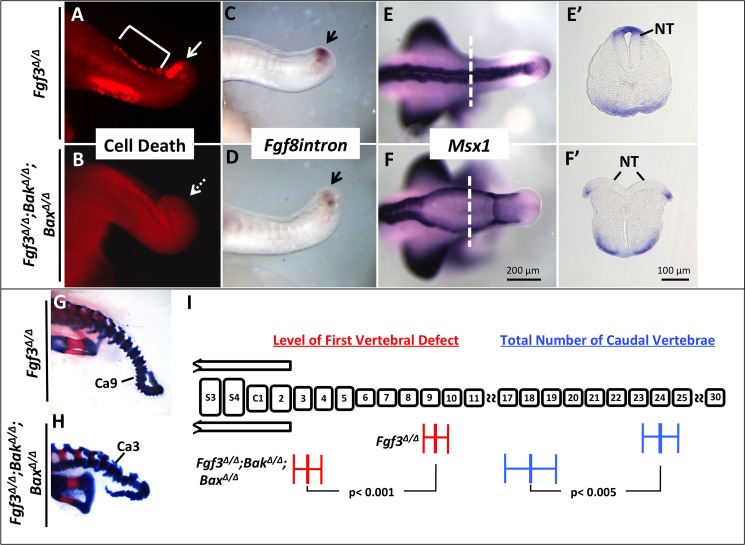
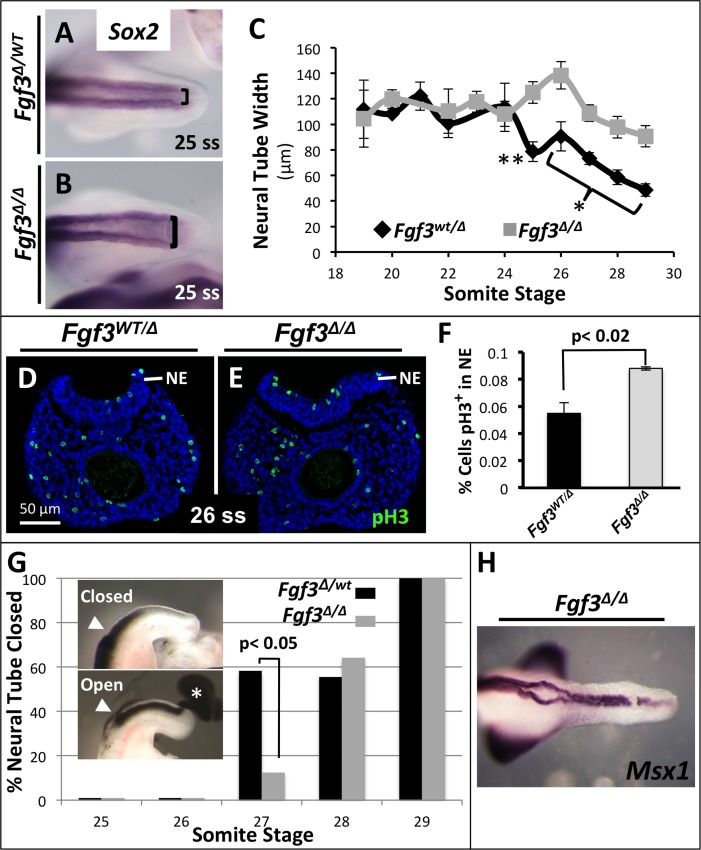
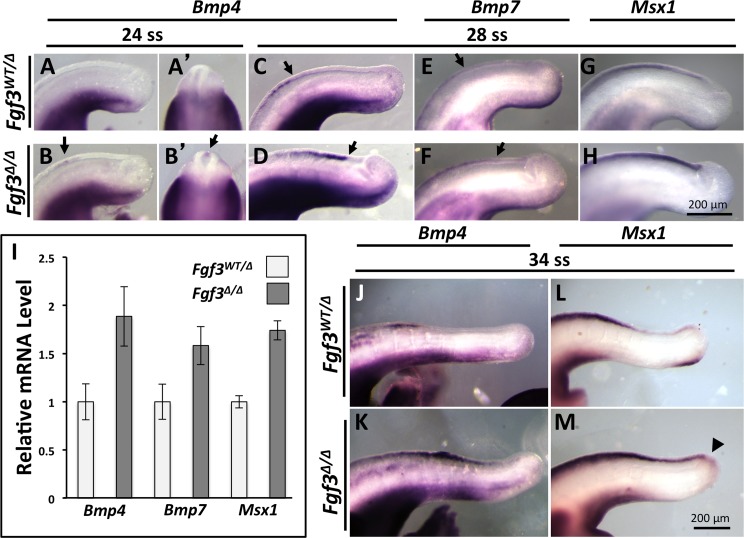
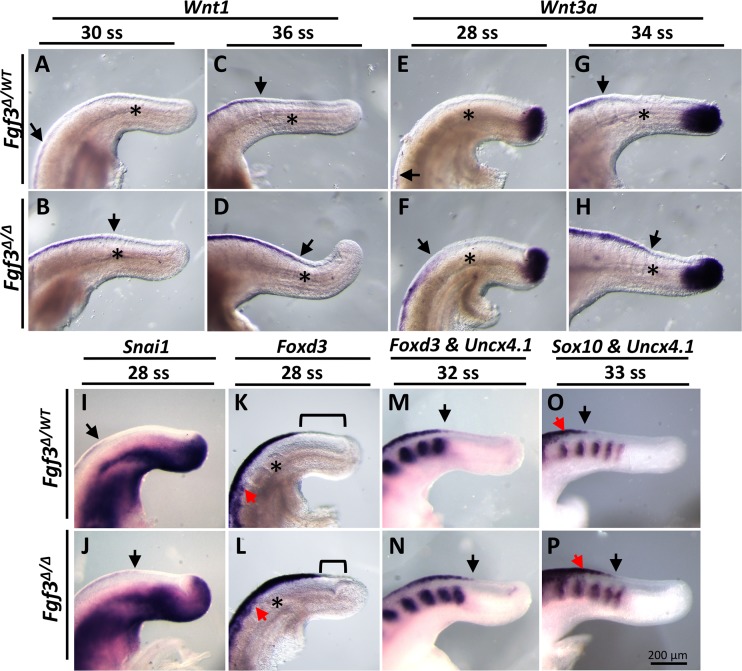
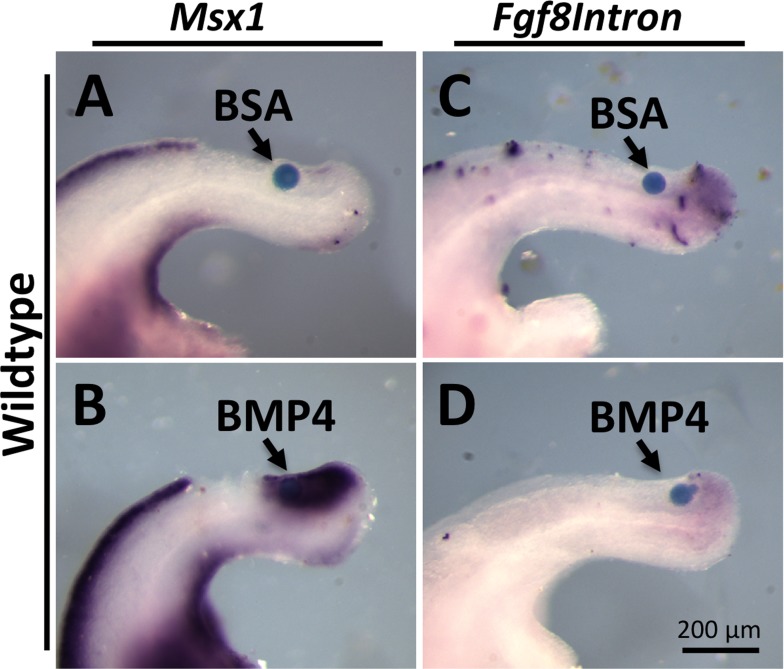
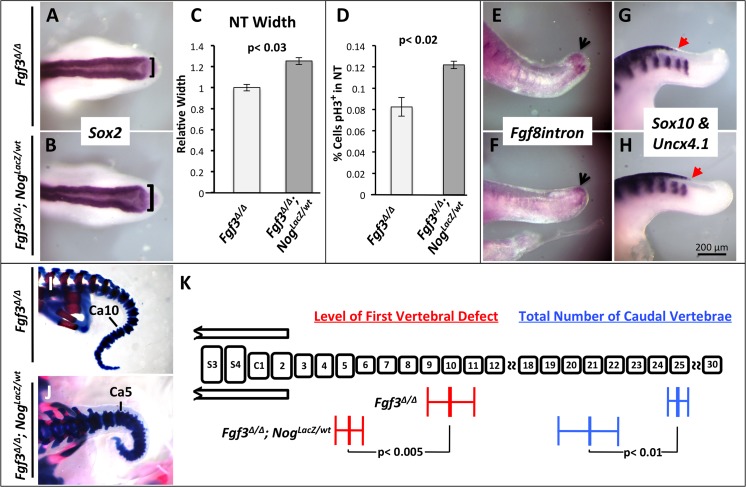
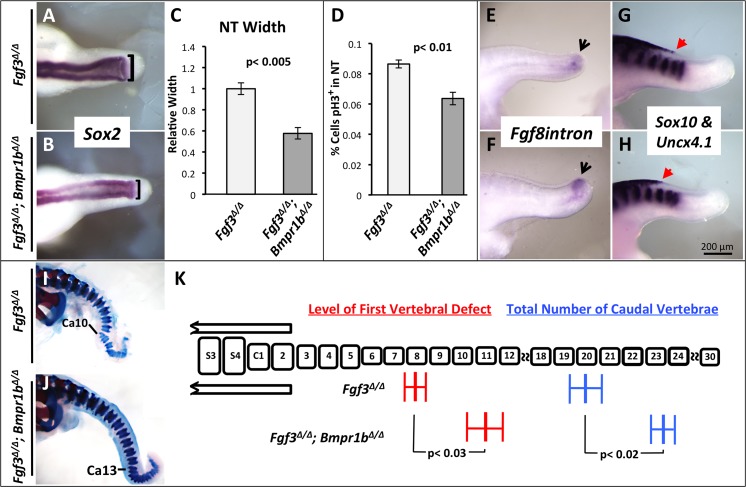
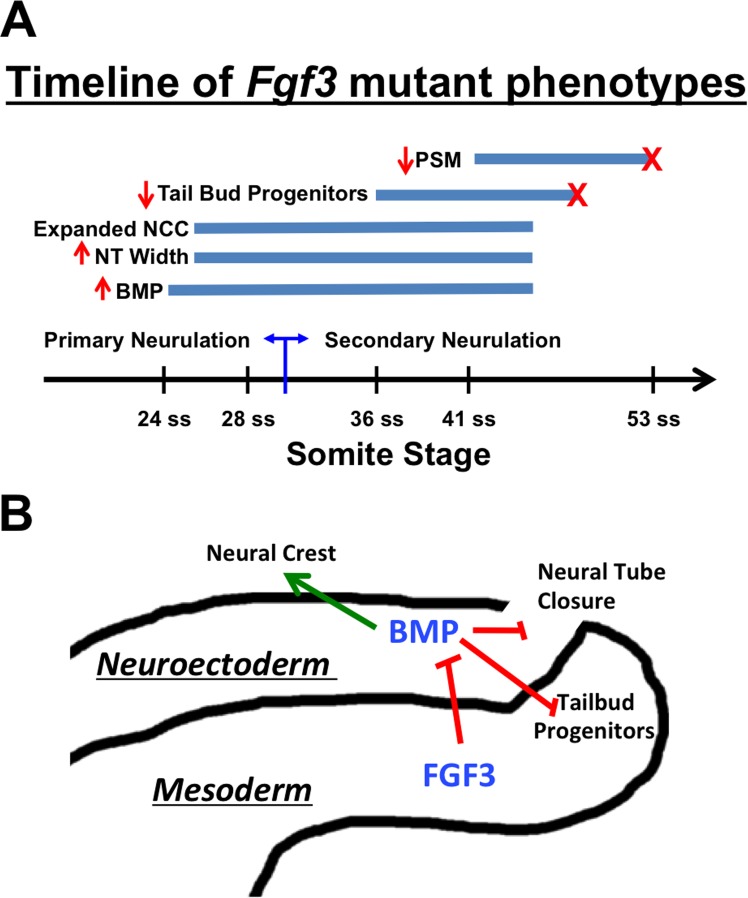
During vertebrate axis extension, adjacent tissue layers undergo profound morphological changes: within the neuroepithelium, neural tube closure and neural crest formation are occurring, while within the paraxial mesoderm somites are segmenting from the presomitic mesoderm (PSM). Little is known about the signals between these tissues that regulate their coordinated morphogenesis. Here, we analyze the posterior axis truncation of mouse Fgf3 null homozygotes and demonstrate that the earliest role of PSM-derived FGF3 is to regulate BMP signals in the adjacent neuroepithelium. FGF3 loss causes elevated BMP signals leading to increased neuroepithelium proliferation, delay in neural tube closure and premature neural crest specification. We demonstrate that elevated BMP4 depletes PSM progenitors in vitro, phenocopying the Fgf3 mutant, suggesting that excessive BMP signals cause the Fgf3 axis defect. To test this in vivo we increased BMP signaling in Fgf3 mutants by removing one copy of Noggin, which encodes a BMP antagonist. In such mutants, all parameters of the Fgf3 phenotype were exacerbated: neural tube closure delay, premature neural crest specification, and premature axis termination. Conversely, genetically decreasing BMP signaling in Fgf3 mutants, via loss of BMP receptor activity, alleviates morphological defects. Aberrant apoptosis is observed in the Fgf3 mutant tailbud. However, we demonstrate that cell death does not cause the Fgf3 phenotype: blocking apoptosis via deletion of pro-apoptotic genes surprisingly increases all Fgf3 defects including causing spina bifida. We demonstrate that this counterintuitive consequence of blocking apoptosis is caused by the increased survival of BMP-producing cells in the neuroepithelium. Thus, we show that FGF3 in the caudal vertebrate embryo regulates BMP signaling in the neuroepithelium, which in turn regulates neural tube closure, neural crest specification and axis termination. Uncovering this FGF3-BMP signaling axis is a major advance toward understanding how these tissue layers interact during axis extension with important implications in human disease.


Conflict of interest statement

The authors have declared that no competing interests exist

Figures

Fig 1
Fig 1. Loss of Fgf3 causes variable anterior-posterior axis truncation and caudal malformation.
(A) Dorsal view of three Fgf3 mutants (Fgf3Δ/Δ) and one littermate Fgf3 heterozygous (Fgf3 Δ/WT) control showing a variably truncated and sometimes “knotted” tail (bottom two samples) in mutants. (B) Skeletal preparations of three E18.5 Fgf3 mutants demonstrating the variable position of the first vertebral defect (arrows; Ca, caudal vertebrae. Dotted lines outline unstained cartilage). (C) Wholemount in situ hybridization (WISH) assays for Fgf3 at the stage indicated. Fgf3 mRNA is detected in the primitive streak (ps, E7.5, E8.5) as well as in the presomitic mesoderm (E8.5–12.5) and tail bud (E9.5–12.5). Expression is absent at E13.5. An apparent dynamic domain of Fgf3 is observed in the anterior PSM (asterisks) (see S1 Fig). Fgf3 expression is confined to mesoderm and absent in the posterior neural tube (C”, with approximate plane of section shown by dotted line in C’. NT, neural tube; psm, presomitic mesoderm, 24 ss); E7.5-E13.5 images taken at the same magnification (scale bar, E13.5); images in C’ and C” taken at the same magnification (scale bar, C”). (D-M) WISH assay for Uncx4.1, which stains the somites, and Msgn1, which stains the caudal PSM, in mutants and littermate controls at the stages indicated. Caudal PSM (Msgn1 domain) is depleted at E12.5 in mutants and E13.5 in controls. D-I are dorsal views; J-M are lateral views. Arrowhead in M indicates touching Uncx4.1 domains. Bars in F and G indicate total PSM length, which is quantified in N. Note that a decrease in the amount of mutant PSM begins at 37 ss followed by a total loss of PSM around 54 ss, resulting with fewer somites in mutants. Error bars represent SEM; significance determined by two-tailed t-test.
Fig 2
Fig 2. Fgf3 mutants have aberrant cell death of tailbud progenitors.
LysoTracker Red staining of Fgf3 mutants (B, D, F) and littermate Fgf3 heterozygous controls (A, C, E), showing a domain of cell death unique to the mutant tails beginning at 36 ss (E10.5) (white arrow, D) and continuing through 44 ss (E11.5) (F); all images taken at the same magnification (scale bar, F). Cleaved caspase-3 staining (red) on a sagittally sectioned 38 ss (E10.5) mutant tailbud showing aberrant cell death in the chordoneural hinge region (G, H; box indicates chordoneural hinge region, NT: neural tube, No: notochord, GT: gut tube); images taken at the same magnification (scale bar, H). (I-N) WISH assay using a riboprobe specific to the nascent Fgf8 mRNA: Fgf8intron, marking the tailbud progenitor domain (black arrows), which is similar between Fgf3 heterozygous controls and Fgf3 mutants at 28 ss (E9.5) (compare J to I), diminished in Fgf3 mutants beginning at 38 ss (E10.5) (compare L to K) and gone in Fgf3 mutants by 44 ss (E11.5) (compare N to M). White arrowheads in I-N indicate a domain of Fgf8intron expression at the end of the tailgut that is unchanged, thus functioning as an internal control. All views are lateral; all images taken at the same magnification (scale bar, N).
Fig 3
Fig 3. Blocking cell death increases severity of Fgf3 mutant malformation.
LysoTracker Red staining of Fgf3 Δ/Δ; Bak Δ/Δ; Bax Δ/Δ (“triple”) mutants (B) and littermate Fgf3 Δ/Δ embryos (A), show a rescue of aberrant cell death in triple mutants (solid arrow in A indicates domain of cell death and dotted arrow in B shows domain of restored cell survival, bracket in A indicates normal domain of cell death in the dorsal neural tube). WISH assays for the markers indicated (C-F). Fgf8intron expression showing a more severe loss of tailbud progenitors (black arrows, D) in triple mutants compared to controls (C). (F, F’) Dorsal view and transverse section showing a lack of neural tube closure in triple mutants (n = 3/5; compare to control (E, E’). Relative position of sections in E’ and F’ indicated by dotted-white lines in E and F. Note that Msx1 was stained to saturation. Skeletal preparations of triple mutants (H) and littermate Fgf3 mutants (G) at E18.5 demonstrating that triple mutants have an anterior shift of the first vertebral defect (Ca, caudal vertebrae) and a more severe truncation, quantified in I. (I) Histogram modeling the caudal vertebral column: elements labeled “S” or “C” represent sacral and caudal vertebrae, respectively. The AP position of the first vertebral defect (red) and total number of vertebral elements (blue) are as shown for each genotype. For Fgf3 Δ/Δ; Bak Δ/Δ; Bax Δ/Δ mutants, n = 3 and for Fgf3Δ/Δ mutants, n = 8. Error bars represent SEM; significance determined by two-tailed t-test. Images A-F are taken at the same magnification (scale bar, F) and E’-F’ are taken at the same magnification (scale bar, F’).
Fig 4
Fig 4. Fgf3 mutants have defects in neuropore closure.
Dorsal view of WISH assay for Sox2 stained posterior neural tubes showing a widened neuropore in Fgf3 mutants (B, bracket) compared to littermate Fgf3 heterozygous controls (A, bracket) at 25 ss, quantified in C. (C) Measurements of posterior neural tube width at various stages demonstrating that the Fgf3 mutant neural tube is first abnormally widened at the 25 ss (** = p< 0.005, 26–29 ss; * = p< 0.04; significance determined by two-tailed t-test.). Phospho-histone H3 staining showing increased proliferation in mutant neuroectoderm (E, compared to control D) quantified in F. Error bars represent SEM, statistical significance determined by two-tailed t-test (NE: neuroepithelium). (G) Injection of ink into the neural tube (position of needle insertion indicated by white arrowheads) of Fgf3 heterozygous control and Fgf3 mutant 25–29 ss embryos reveals a significant delay in closure of mutant neural tube (27 ss) (asterisk marks ink from open neuropore). Neural tube closure is complete in all mutants and controls by 29 ss; statistical significance determined by n-1 two proportions test. (H) Dorsal view of WISH assay for Msx1 mRNA (stained to saturation) shows failure of neural tube closure in an Fgf3 mutant at 10.5.
Fig 5
Fig 5. Fgf3 mutants have upregulated BMP-signaling in the neural tube.
Lateral view (A, B) or dorsal view (A’, B’, focusing on cross-section of neural tube) of WISH assay reveals that Bmp4 expression initiates within the dorsal neural tube of Fgf3 mutants at 24 ss (B, B’, arrow) but not in controls (A, A’) and is further increased and posteriorly expanded in mutants at 28ss (D, arrows indicate posterior limit of expression, compare to C). (A-M) are lateral views of WISH using the probe, genotype and stage indicated. Bmp7 expression shows a caudal expansion of expression domain in Fgf3 mutants (F, arrows indicate posterior limit of expression, compare to E). Msx1 is also upregulated and posteriorly shifted in Fgf3 mutants (H, compare to G). Note that Msx1 WISH was performed for a relatively short period to reveal qualitative differences in intensity between genotypes. (I) qPCR using primers specific to Bmp4, Bmp7, or Msx1 confirming upregulation in neural tube tissue; error bars represent SEM, graph is representative of at least three experiments. At 34 ss Bmp4 and Msx1 expression continues to be caudally expanded in Fgf3 mutants (K and M compare to J and L). At this stage Msx1 expression occurs in the PSM (arrowhead in M). Images A-H are taken at the same magnification (scale bar, H) and J-M are taken at the same magnification (scale bar, M).
Fig 6
Fig 6. Fgf3 mutants have caudally expanded neural crest.
WISH assay for markers indicated (A-P, Uncx4.1 expression marks somites) showing expanded neural crest in Fgf3 mutants (B, D, F, H, J, L, N, P) compared to stage matched littermate controls (A, C, E, G, I, K, M, O). Bracket K and L indicates distance between posterior limit of Foxd3 expression and end of NT; red arrows indicate caudal limit of migratory neural crest cells; black arrows indicate caudal limit of premigratory neural crest in the dorsal-midline; asterisks indicate last formed somite. All images taken at the same magnification (scale bar, P).
Fig 7
Fig 7. Exogenous BMP reduces PSM progenitors.
WISH assay for markers indicated on tail explant cultures with a BSA soaked bead (A, C) or BMP4 soaked bead (B, D) inserted into the posterior neural tube of 30 ss wildtype embryos (For A-D, n = 4/4, 5/5, 3/4, 5/5 respectively).
Fig 8
Fig 8. Increased BMP-signaling in Fgf3 mutants worsens axis truncation.
(A, B, E-H) WISH assays for probe and genotype shown. (A, B) are dorsal views; (E-H) are lateral views. Fgf3Δ/Δ; NogLacz/wt mutants have a wider NT at 27 ss compared to Fgf3Δ/Δ littermate controls, (B compare to A; black brackets indicate measurement of NT width, quantified in C), an increase in neuroectoderm proliferation as measured by phospho-histone H3 staining (D, 26–27 ss, n = 3 each, percentage represents positive nuclei per total nuclei), a further loss of tailbud progenitors at 37 ss (F, compare to E, black arrows denote tailbud progenitor domain) and a caudal expansion of neural crest at 33 ss (H compare to G; red arrows indicate posterior limit of expanded neural crest and somites are marked by Uncx4.1 expression). Skeletal preparations of E18.5 Fgf3Δ/Δ; NogLacz/wt mutants (J) and littermate Fgf3Δ/Δ mutants (I) showing an increase in severity of axis malformation and truncation in the compound mutant (Ca: caudal vertebra, marking most anterior vertebral malformation); (K) Histogram is similar to that described in Fig 3. For Fgf3Δ/Δ; NogLacz/wt mutants, n = 9 and for Fgf3Δ/Δ mutants, n = 12. Error bars represent SEM; significance determined by two-tailed t-test. Images in A, B, E–H were taken at the same magnification (scale bar, H).
Fig 9
Fig 9. Reduction of BMP-signaling in Fgf3 mutants partially rescues axis extension.
(A, B, E-H) WISH assays for probe and genotype shown. (A, B) are dorsal views; (E-H) are lateral views. Fgf3Δ/Δ; Bmpr1bΔ/Δ compound mutants, compared to Fgf3Δ/Δ mutants show a narrower, more normal neural tube at 28 ss (B compare to A; black brackets indicate measurement of NT width, quantified in C), a decrease in neuroectoderm proliferation as measured by phospho-histone H3 staining (D, 26–27 ss, n = 3 each, percentage represents positive nuclei per total nuclei), an increase in tailbud progenitors (F compare to E; black arrows denote tailbud progenitor domain) and a rostrally shifted, more normal, posterior limit of neural crest cells at 34 ss (H compare to G; red arrows indicate posterior limit of neural crest expansion and somites are marked by Uncx4.1 expression). Skeletal preparations of E18.5 Fgf3Δ/Δ; Bmpr1bΔ/Δ mutants (J) and littermate Fgf3Δ/Δ mutants (I) showing a shift toward normality in both axis malformation and truncation in the compound mutant (Ca: caudal vertebra, marking most anterior vertebral malformation); (K) Histogram is similar to that described in Fig 3. For Fgf3Δ/Δ; Bmpr1bΔ/Δ mutants, n = 8 and for Fgf3Δ/Δ mutants, n = 10. Error bars represent SEM; significance determined by two-tailed t-test. Images in A, B, E–H were taken at the same magnification (scale bar, H).
Fig 10
Fig 10. Model and timeline of phenotypes.
(A) Timeline of phenotypes due to loss of Fgf3, indicating onset and duration of observed increased BMP signaling in the neural tube, aberrant neural tube width and caudal neural crest expansion, loss of tailbud progenitors (indicated by Fgf8intron staining), and decreased PSM. Red “X” indicates premature loss of tailbud progenitors (Fgf8intron lost around ~48 ss as opposed to normal loss at >55 ss), and premature loss of PSM. NCC, neural crest cells; NT, neural tube; PSM, presomitic mesoderm. (B) Model of FGF3 signaling from the PSM to limit BMP signaling in the neural tube, which positively affects neural crest cell specification, and negatively affects neural tube closure and tailbud progenitors in the mesoderm.

Similar articles

Cited by

References

    1. Zohn IE (2012) Mouse as a model for multifactorial inheritance of neural tube defects. Birth defects research Part C, Embryo today: reviews 96: 193–205. - PubMed
    1. Greene ND, Copp AJ (2014) Neural tube defects. Annu Rev Neurosci 37: 221–242. 10.1146/annurev-neuro-062012-170354 - DOI - PMC - PubMed
    1. Wilde JJ, Petersen JR, Niswander L (2014) Genetic, epigenetic, and environmental contributions to neural tube closure. Annu Rev Genet 48: 583–611. 10.1146/annurev-genet-120213-092208 - DOI - PMC - PubMed
    1. Parker SE, Mai CT, Canfield MA, Rickard R, Wang Y, et al. (2010) Updated National Birth Prevalence estimates for selected birth defects in the United States, 2004–2006. Birth Defects Res A Clin Mol Teratol 88: 1008–1016. 10.1002/bdra.20735 - DOI - PubMed
    1. Harris MJ, Juriloff DM (2007) Mouse mutants with neural tube closure defects and their role in understanding human neural tube defects. Birth defects research Part A, Clinical and molecular teratology 79: 187–210. - PubMed

Publication types

MeSH terms