. 2016 Jun 14;7(24):36049-36064.
doi: 10.18632/oncotarget.9102.

Oncogenic function of the homeobox A13-long noncoding RNA HOTTIP-insulin growth factor-binding protein 3 axis in human gastric cancer

Affiliations

Oncogenic function of the homeobox A13-long noncoding RNA HOTTIP-insulin growth factor-binding protein 3 axis in human gastric cancer

Sophie Sw Wang et al. Oncotarget. .

Abstract

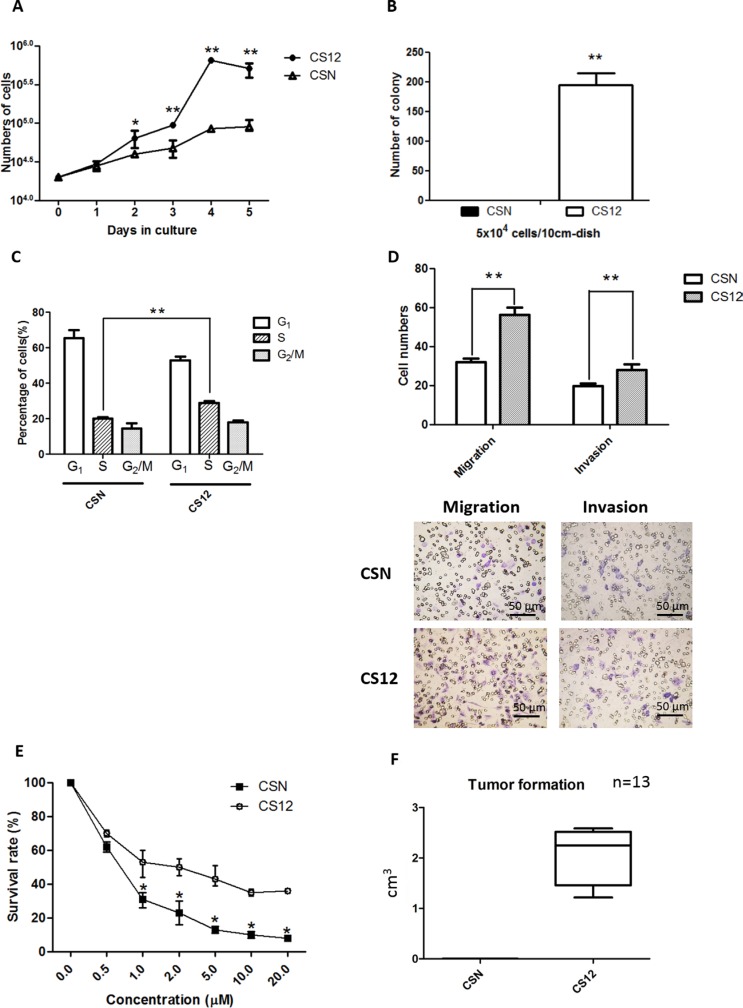
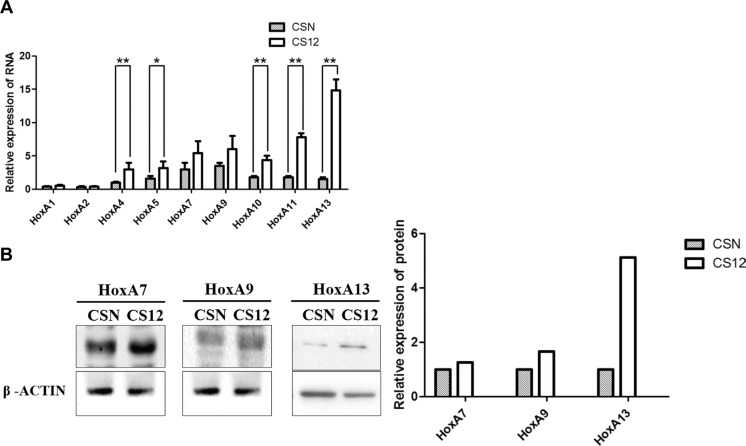
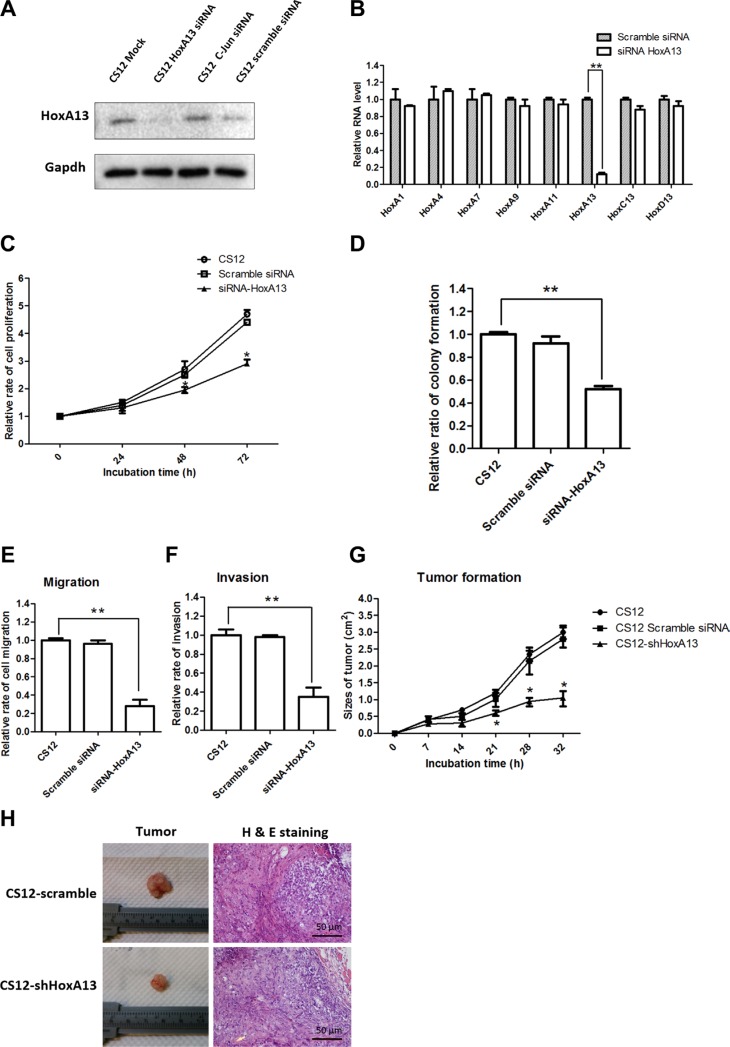
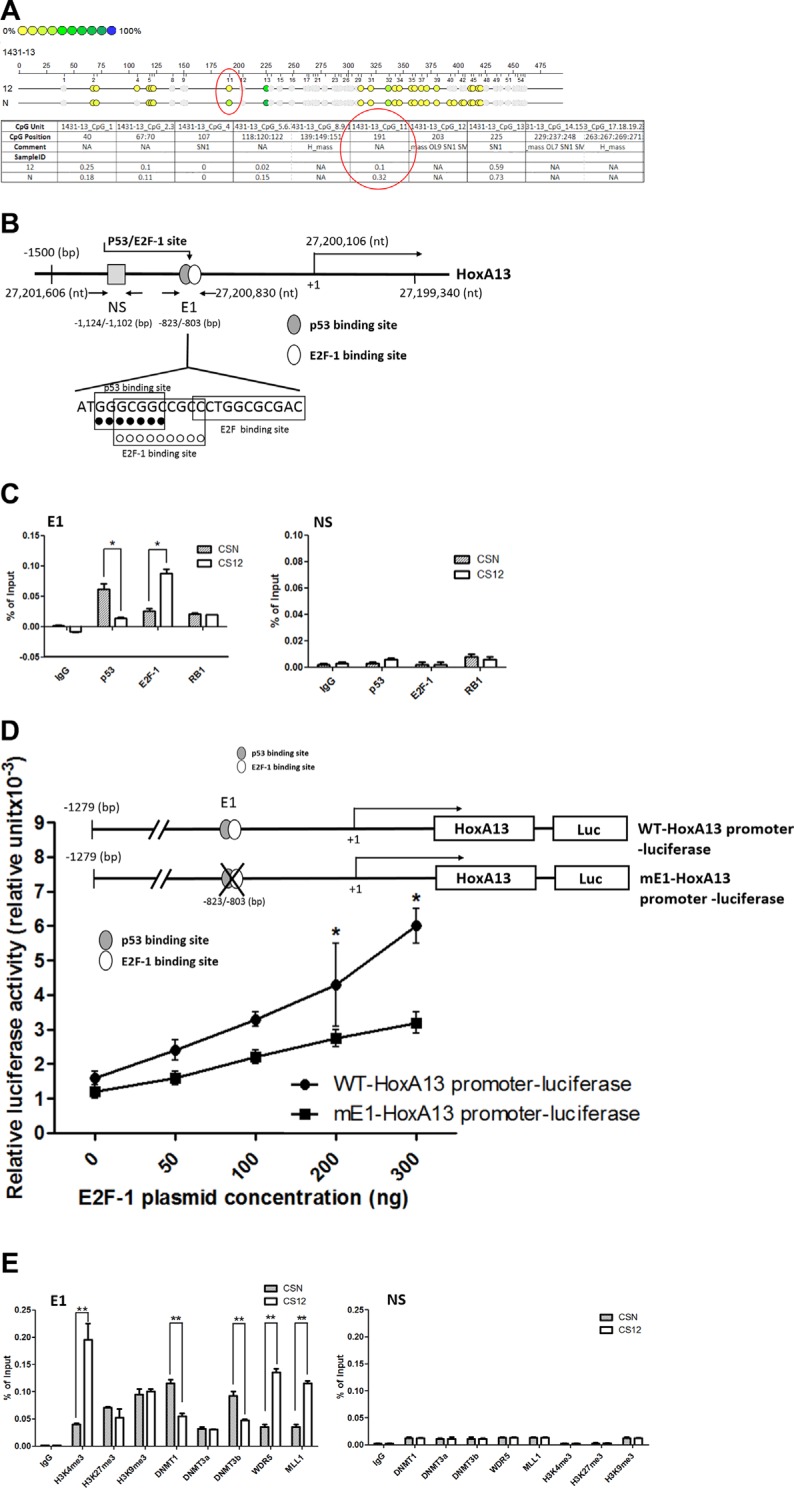
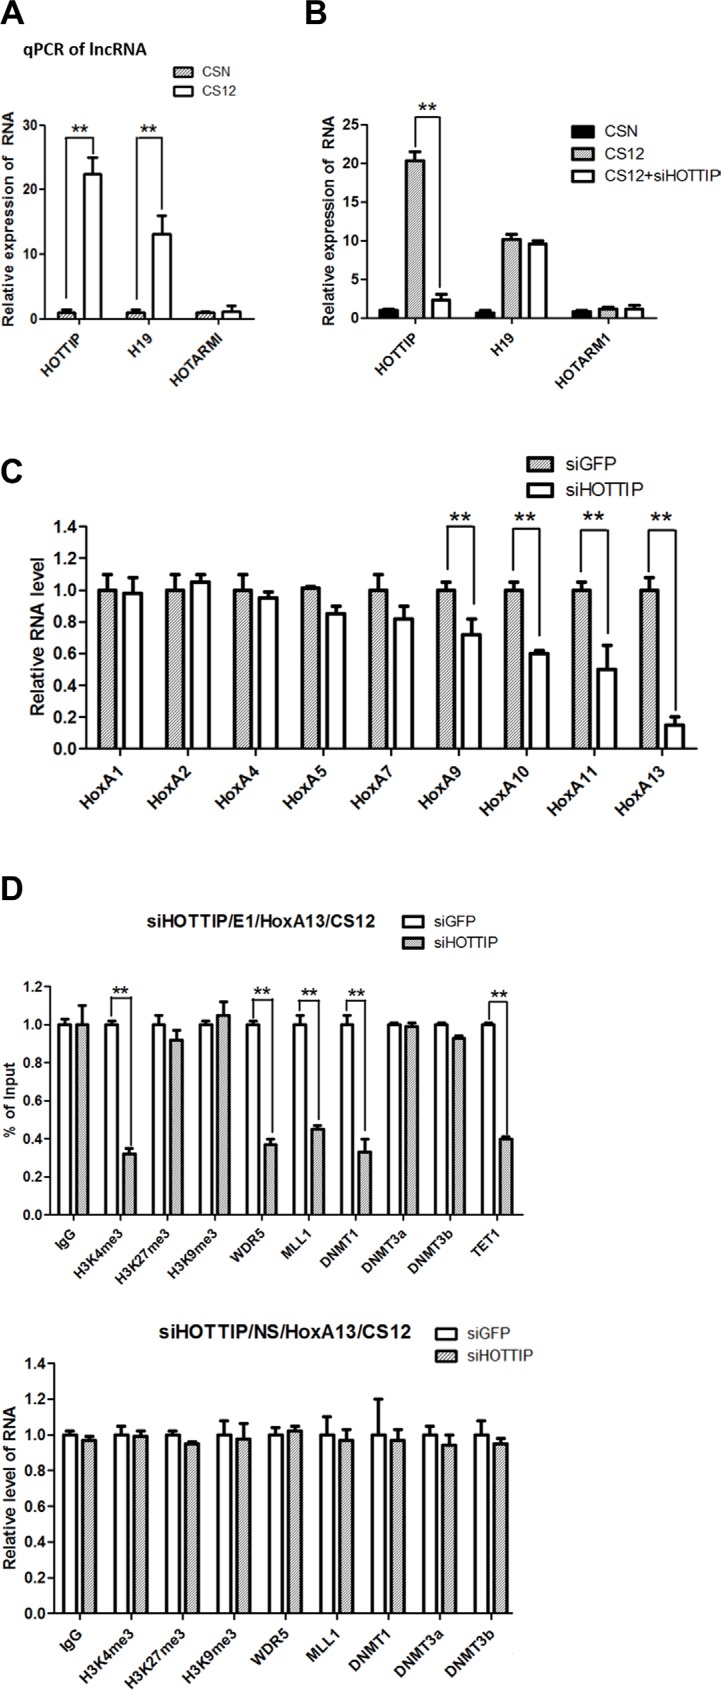
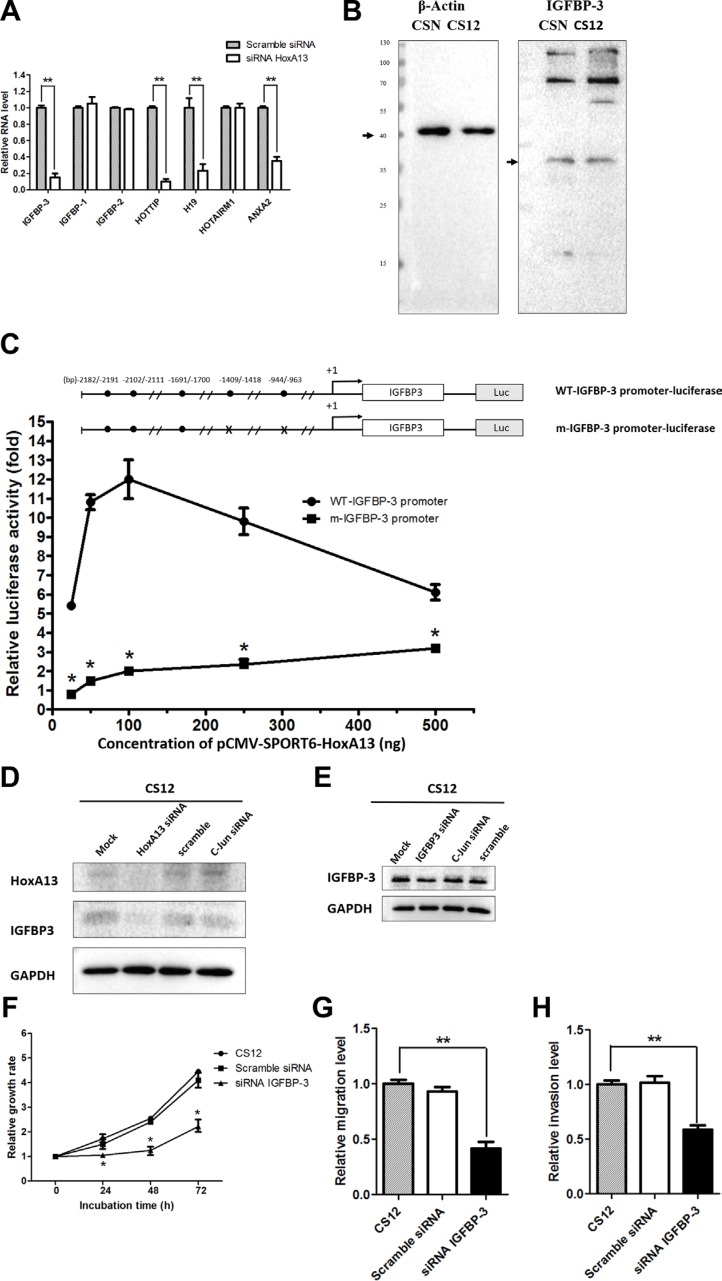
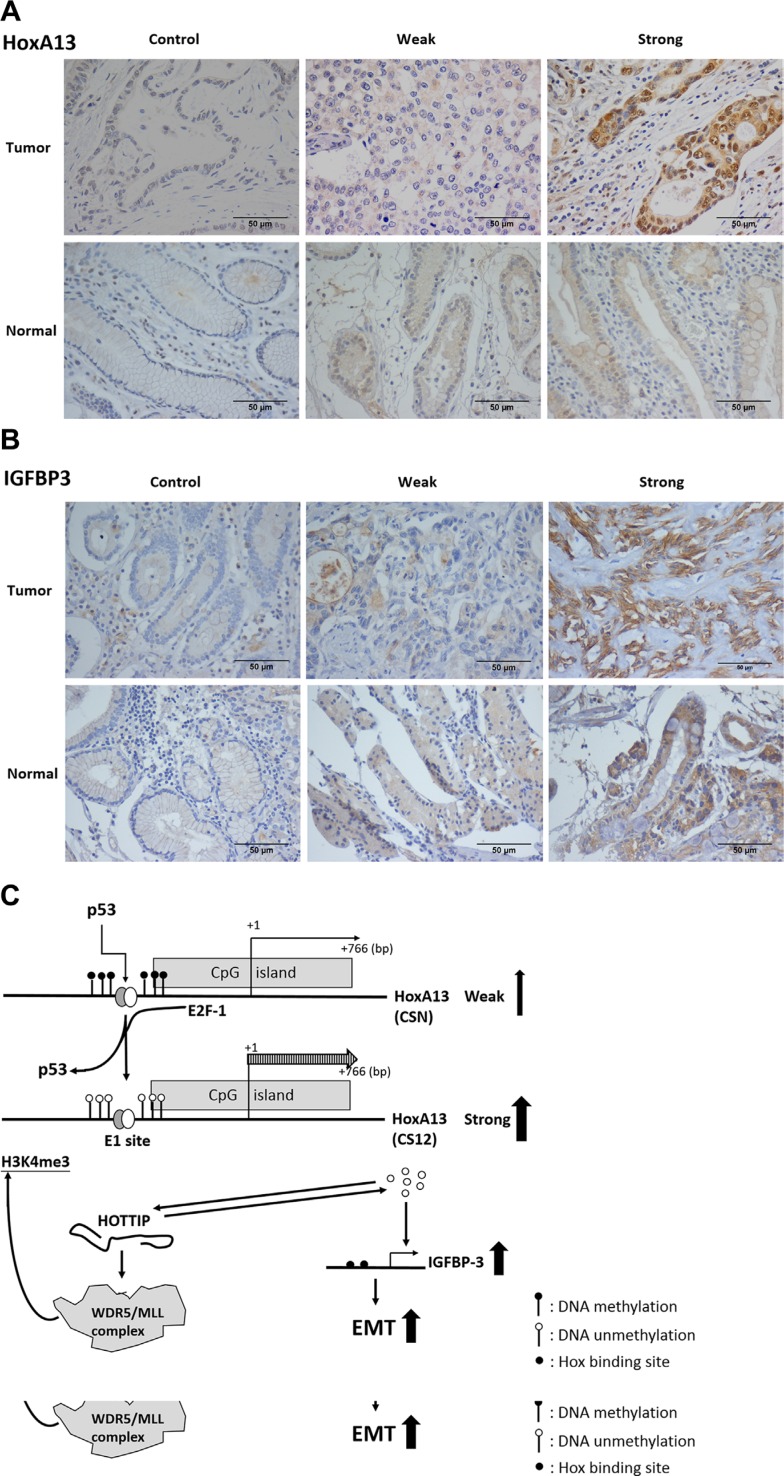
To study the mechanisms of gastric tumorigenesis, we have established CSN cell line from human normal gastric mucosa, and CS12, a tumorigenic and invasive gastric cancer cell line from CSN passages. Many stem cell markers were expressed in both CSN and CS12 cells, but LGR5 and NANOG were expressed only in CS12 cells. Increased expression of homeobox A13 (HoxA13) and its downstream cascades was significant for the tumorigenic activity of CS12 cells, and was associated with recruitment of E2F-1 to HoxA13 promoter accompanied with increased trimethylation of histone H3 lysine 4 (H3K4me3) at the hypomethylated E2F motifs. Knockdown of HoxA13 caused the downregulation of long non-coding RNA HOTTIP and insulin growth factor-binding protein 3 (IGFBP-3) genes, indicating that both were targets of HoxA13. Concurrent regulation of HoxA13-HOTTIP was mediated by the mixed lineage leukemia-WD repeat domain 5 complex, which caused the trimethylation of H3K4 and then stimulated cell proliferation. HoxA13 transactivated the IGFBP-3 promoter through the HOX-binding site. Activation of IGFBP-3 stimulated the oncogenic potential and invasion activity. Increased expression of HoxA13 (63.2%) and IGFBP-3 (28.6%) was detected in human gastric cancer tissues and was found in the gastric cancer data of The Cancer Genome Atlas. Taken together, the HoxA13-HOTTIP-IGFBP-3 cascade is critical for the carcinogenic characteristics of CS12 cells.

Keywords: HOTTIP; HoxA13; IGFBP-3; gastric cancer cells; p53-E2F signaling.


Conflict of interest statement

The authors have no conflicts of interest to declare.

Figures

Figure 1
Figure 1. Comparative features of CSN and CS12 cells
(A) Cell proliferation of CSN and CS12 cells. The mean number of cells (trypan blue dye-exclusion test) was determined for five independent plates. CSN and CS12 cells were starved in MEMα containing 0.1% FCS for 24 h and then replated in MEMα containing 10% FCS and cultured for 5 days. (B) Colony formation of CSN and CS12 cells. Cells were plated in gelatin-coated dishes and colonies with a diameter > 2 mm were counted 2 weeks later. (C) Serum-starved cells were cultured in DMEM containing 10% FCS for 18 h, stained with PI, and subjected to flow cytometric analysis to determine the percentage of cells in each cell cycle. (D) The percentage of invasion and migration was calculated based on the ratio of the number of invading cells vs the total number of CSN and CS12 cells used in inoculation. (E) The drug resistance capacity of CS12 cells was measured as the survival rate of cells when exposed to drug such as 5FU. (F) Tumor sizes with time in SCID mice subcutaneously injected with CS12 cells and CSN normal cells. CS12 cells, not CSN cells, form tumors. Data in A–E were derived from five independent experiments and are presented as mean ± SEM (two-tailed Student t test; *p < 0.05; **p < 0.01).
Figure 2
Figure 2. Comparative expression of HOXA family in CSN and CS12 cells
(A) Comparative mRNA expression of HOXA family genes in CSN and CS12 cells was examined by semiquantitative RT-PCR as shown in the Materials and Methods. The data were derived from five independent experiments, and are presented as mean ± SEM (two-tailed Student's t test; **p < 0.01). Relative expression was calculated by normalization of the HoxA4 mRNA in CSN cells as 1.0. (B) Comparative expression of HoxA7, HoxA9 and HoxA13 proteins was examined by western blot in CSN and CS12 cells. The intensity of bands in western blotting was quantitated using GeneTools (Syngene USA, Frederick, MD, USA) and Image Lab software (Bio-Rad). The relative intensity of each band was calculated by normalization of the corresponding band image of CSN as 1.0.
Figure 3
Figure 3. Effect of HoxA13 knockdown in tumorigenicity of CS12 cells
(A) Expression of HoxA13 was examined by western blot in CS12 cells treated with siRNA against HoxA13, c-Jun, IGFBP-3, or scrambled control as described in the Materials and Methods. (B) Expression of mRNA levels of the HOX family was examined by qPCR as described in the Materials and Methods. The level of HoxA1 mRNA in scramble siRNA treated CS12 cells was considered to be 1.0. (C) The effects of siRNA-HoxA13 on cell growth in CS12 cells were assessed as described in the Materials and Methods. (D) The effects of siRNA-HoxA13 on colony formation in CS12 cells was assessed as described in Figure 1B. The effects of siRNA-HoxA13 on migration (E) and invasion (F) activities were assessed as described in Figure 1D. (G) The effects of the siRNA-HoxA13 on tumor formation. The siRNA-HoxA13 and scramble RNA were introduced into CS12 cells (5 × 10⁶), and then the cells were injected subcutaneously into male SCID mice as described in the Materials and Methods, and the tumor size was measured. (H) Representative image of the tumor. All data in B–G were derived from six independent experiments and are presented as mean ± SEM (two-tailed Student t test; *p < 0.05, **p < 0.01).
Figure 4
Figure 4. DNA methylation of E1 site in CpG islands of HoxA13 promoter
(A) DNA methylation analysis of HoxA13 promoter. The relative extent of DNA methylation is indicated as intensity; complete methylation with a value of 1.0 is shown as green and hypomethylation is indicated by yellow dots. The red circle shows significant difference in DNA methylation at CpG 11 (1,431–13 segment) of the HoxA13 promoter. N: CSN cells; 12; CS12 cells. NA indicates not added. (B) Schematic representation of the promoter region of HoxA13 gene. The differential methylated CpG 11 site was found to be the p53/E2F-1 binding site (E1 site; −823 to −803 bp). A nonspecific site (NS; gray square) for ChIP-qPCR was assigned at −1,124 to −1,102 (bp). +1 indicates the transcriptional start site. (C) ChIP–qPCR analysis of p53, E2F-1, RB-1, and IgG (negative control) was performed in CSN and CS12 cells as described in the Materials and Methods. Input DNA (1/20-fold) was also analyzed. (D) Luciferase-linked wild type (WT) or mE1 mutant-promoter, control pGL4, and various amounts (0, 50, 100, 200, and 300 ng) of pCMV-SPORT6-E2F-1 were transfected into CS12 cells, and luciferase activity was measured as described in the Materials and Methods. (E) ChIP–qPCR analysis using antibodies against DNA methyltransferase family members, methylated histones, and the WDR5–MLL complex were performed in CSN and CS12 cells. Input DNA (1/20-fold) was also analyzed. The data C-E are presented as mean ± SEM (two-tailed Student t test; *p < 0.05, **p < 0.01).
Figure 5
Figure 5. The epigenetic role of HOTTIP in the E1 site of HoxA13 promoter
(A) Relative expression of long noncoding RNA (lncRNA) in CSN and CS12 cells. The expression of lncRNA in CSN cells was taken as 1.0. (B) Effect of siRNA to HOTTIP on the expression of lncRNAs in CSN and CS12 cells. (C) Effect of siRNAs to HOTTIP on the expression of the HOXA gene family. Each expression of siRNA-GFP treated CS12 cells was taken as 1.0. (D) Effect of siRNA-HOTTIP on recruitment of DNA methyltransferases, WDR5, MML1, and methylation of histones at the E1 and NS sites of the HoxA13 promoter. Each expression of siRNA-GFP treated cells was taken as 1.0. All data are presented as mean ± SEM (two-tailed Student t test; **p < 0.01).
Figure 6
Figure 6. IGFBP-3 and HOTTIP are downstream gene to HoxA13 in CS 12 cells
(A) Effect of siRNA-HoxA13 on mRNA expression of IGFBP family and lncRNAs was examined by qPCR in CS12 cells. Each expression level of scramble-siRNA treated CS12 cells was considered to be 1.0. (B) Expression of IGFBP-3 protein was examined by western blot in CSN and CS12 cells. (C) The luciferase constructs of WT-IGFBP-3 promoter and its mutant-IGFBP-3 promoter with various amounts of pcDNA3-HoxA13 (25 ng, 50 ng, 100 ng, 250 ng, and 500 ng) were transfected into CS12 cells. Two days after transfection, cells were harvested and luciferase activity was measured as described in the Materials and Methods. The luciferase activity of m-IGFBP-2 promoter-luciferase in the presence of 25 ng of pcDNA3-HoxA13 was considered to be 1.0. (D) Expression of IGFBP-3 in CS12 cells treated with siRNA-HoXA13 or scramble or off target siRNA was assessed as described in Materials and Methods. (E) Expression of IGFBP-3 in CS12 cells treated with siRNA-IBGBP-3 or scrambled siRNA was examined by western blot. (F) The effect of siRNA-IGFBP-3 on cell growth in CS12 cells was assessed as described in the Materials and Methods. (G), (H) The effect of siRNA to IGFBP-3 on migration (G) and invasion (H) activities was assessed in described in the Materials and Methods. The value of CS12 was considered to be 1.0. Data were derived from five independent experiments and presented as mean ± SEM (two-tailed Student t test; *p < 0.05, **p < 0.01).
Figure 7
Figure 7. Expression of HoxA13 and IGFBP-3 in specimens of gastric cancer patients
(A, B) Representative immunohistochemical staining shows strong (score > 4), weak (score < 2) and non (isotype control) expression of HoxA13 (A) and IGFBP-3 (B). (C) Schematic representation of the HoxA13–HOTTIP–IGFBP-3 axis during the development of gastric cancer. EMT: epithelial mesenchymal transition.

References

    1. Dolle P, Izpisua-Belmonte JC, Brown JM, Tickle C, Duboule D. HOX-4 genes and the morphogenesis of mammalian genitalia. Genes Dev. 1991;5:1767–1767. - PubMed
    1. Yokouchi Y, Sakiyama J, Kuroiwa A. Coordinated expression of Abd-B subfamily genes of the HoxA cluster in the developing digestive tract of chick embryo. Dev Biol. 1995;169:76–89. - PubMed
    1. Perez WD, Weller CR, Shou S, Stadler HS. Survival of Hoxa13 homozygous mutants reveals a novel role in digit patterning and appendicular skeletal development. Dev Dyn. 2010;239:446–457. - PMC - PubMed
    1. Goodman FR, Bacchelli C, Brady AF, Brueton LA, Fryns JP, Mortlock DP, Innis JW, Holmes LB, Donnenfeld AE, Feingold M, Beemer FA, Hennekam RC, Scambler PJ. Novel HOXA13 mutations and the phenotypic spectrum of hand-foot-genital syndrome. Am J Hum Genet. 2000;67:197–202. - PMC - PubMed
    1. Mortlock DP, Innis JW. Mutation of HOXA13 in hand-foot-genital syndrome. Nat Genet. 1997;15:179–180. - PubMed

MeSH terms

Substances