Airway Progenitor Clone Formation Is Enhanced by Y-27632-Dependent Changes in the Transcriptome
- PMID: 27144410
- PMCID: PMC5023026
- DOI: 10.1165/rcmb.2015-0274MA
Airway Progenitor Clone Formation Is Enhanced by Y-27632-Dependent Changes in the Transcriptome
Abstract
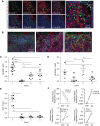
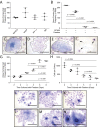
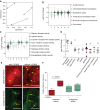
The application of conditional reprogramming culture (CRC) methods to nasal airway epithelial cells would allow more wide-spread incorporation of primary airway epithelial culture models into complex lung disease research. In this study, we adapted the CRC method to nasal airway epithelial cells, investigated the growth advantages afforded by this technique over standard culture methods, and determined the cellular and molecular basis of CRC cell culture effects. We found that the CRC method allowed the production of 7.1 × 10(10) cells after 4 passages, approximately 379 times more cells than were generated by the standard bronchial epithelial growth media (BEGM) method. These nasal airway epithelial cells expressed normal basal cell markers and could be induced to form a mucociliary epithelium. Progenitor cell frequency was significantly higher using the CRC method in comparison to the standard culture method, and progenitor cell maintenance was dependent on addition of the Rho-kinase inhibitor Y-27632. Whole-transcriptome sequencing analysis demonstrated widespread gene expression changes in Y-27632-treated basal cells. We found that Y-27632 treatment altered expression of genes fundamental to the formation of the basal cell cytoskeleton, cell-cell junctions, and cell-extracellular matrix (ECM) interactions. Importantly, we found that Y-27632 treatment up-regulated expression of unique basal cell intermediate filament and desmosomal genes. Conversely, Y-27632 down-regulated multiple families of protease/antiprotease genes involved in ECM remodeling. We conclude that Y-27632 fundamentally alters cell-cell and cell-ECM interactions, which preserves basal progenitor cells and allows greater cell amplification.
Keywords: Y-27632; airway stem progenitor; clone-forming cell frequency; conditionally reprogrammed cells.
Figures


Similar articles
-
Long-Term Culture of Distal Airway Epithelial Cells Allows Differentiation Towards Alveolar Epithelial Cells Suited for Influenza Virus Studies.EBioMedicine. 2018 Jul;33:230-241. doi: 10.1016/j.ebiom.2018.05.032. Epub 2018 Jun 22. EBioMedicine. 2018. PMID: 29937069 Free PMC article.
-
Long-term differentiating primary human airway epithelial cell cultures: how far are we?Cell Commun Signal. 2021 May 27;19(1):63. doi: 10.1186/s12964-021-00740-z. Cell Commun Signal. 2021. PMID: 34044844 Free PMC article. Review.
-
Rho-associated protein kinase inhibition enhances airway epithelial Basal-cell proliferation and lentivirus transduction.Am J Respir Cell Mol Biol. 2013 Sep;49(3):341-7. doi: 10.1165/rcmb.2013-0046TE. Am J Respir Cell Mol Biol. 2013. PMID: 23713995 Free PMC article.
-
ROCK inhibitor Y-27632 suppresses dissociation-induced apoptosis of murine prostate stem/progenitor cells and increases their cloning efficiency.PLoS One. 2011 Mar 28;6(3):e18271. doi: 10.1371/journal.pone.0018271. PLoS One. 2011. PMID: 21464902 Free PMC article.
-
[Regeneration of airway epithelium].Rev Mal Respir. 2014 Apr;31(4):300-11. doi: 10.1016/j.rmr.2013.11.001. Epub 2013 Dec 8. Rev Mal Respir. 2014. PMID: 24750950 Review. French.
Cited by
-
Conditional reprogramming: next generation cell culture.Acta Pharm Sin B. 2020 Aug;10(8):1360-1381. doi: 10.1016/j.apsb.2020.01.011. Epub 2020 Jan 26. Acta Pharm Sin B. 2020. PMID: 32963937 Free PMC article. Review.
-
Conditional cell reprogramming for modeling host-virus interactions and human viral diseases.J Med Virol. 2020 Nov;92(11):2440-2452. doi: 10.1002/jmv.26093. Epub 2020 Jun 16. J Med Virol. 2020. PMID: 32478897 Free PMC article. Review.
-
Minimally invasive skin tape strip RNA sequencing identifies novel characteristics of the type 2-high atopic dermatitis disease endotype.J Allergy Clin Immunol. 2018 Apr;141(4):1298-1309. doi: 10.1016/j.jaci.2017.10.046. Epub 2018 Jan 6. J Allergy Clin Immunol. 2018. PMID: 29309794 Free PMC article. Clinical Trial.
-
Dual RNA-seq reveals viral infections in asthmatic children without respiratory illness which are associated with changes in the airway transcriptome.Genome Biol. 2017 Jan 19;18(1):12. doi: 10.1186/s13059-016-1140-8. Genome Biol. 2017. PMID: 28103897 Free PMC article.
-
Systematic Computational Identification of Variants That Activate Exonic and Intronic Cryptic Splice Sites.Am J Hum Genet. 2017 May 4;100(5):751-765. doi: 10.1016/j.ajhg.2017.04.001. Am J Hum Genet. 2017. PMID: 28475858 Free PMC article.
References
-
- Fields WR, Desiderio JG, Putnam KP, Bombick DW, Doolittle DJ. Quantification of changes in c-myc mRNA levels in normal human bronchial epithelial (NHBE) and lung adenocarcinoma (A549) cells following chemical treatment. Toxicol Sci. 2001;63:107–114. - PubMed
-
- Karp PH, Moninger TO, Weber SP, Nesselhauf TS, Launspach JL, Zabner J, Welsh MJ. An in vitro model of differentiated human airway epithelia: methods for establishing primary cultures. Methods Mol Biol. 2002;188:115–137. - PubMed
-
- Fulcher ML, Gabriel S, Burns KA, Yankaskas JR, Randell SH. Well-differentiated human airway epithelial cell cultures. Methods Mol Med. 2005;107:183–206. - PubMed
-
- Wu R. Culture of normal human airway epithelial cells and measurement of mucin synthesis and secretion. Methods Mol Med. 2000;44:31–39. - PubMed
Publication types
MeSH terms
Substances
Grants and funding
LinkOut - more resources
Full Text Sources
Other Literature Sources
Medical
Molecular Biology Databases

