

Androgen suppresses testicular cancer cell growth in vitro and in vivo
- PMID: 27144435
- PMCID: PMC5085223
- DOI: 10.18632/oncotarget.9109
Androgen suppresses testicular cancer cell growth in vitro and in vivo
Abstract
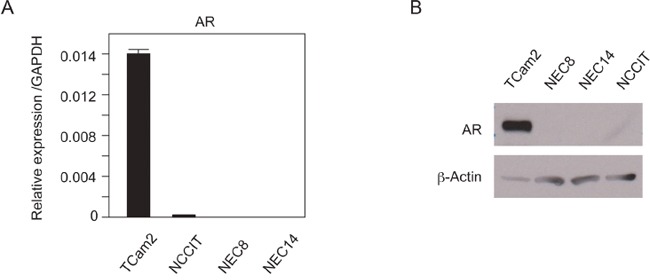
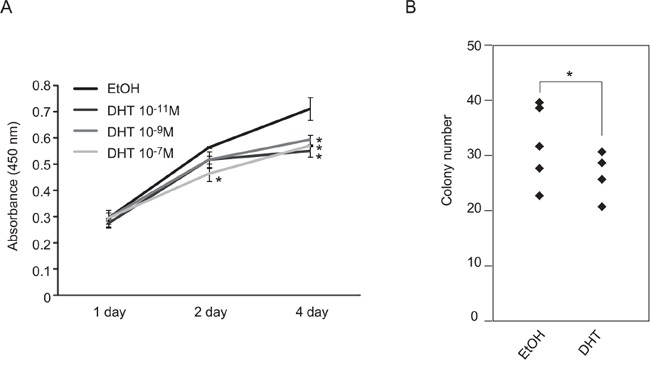
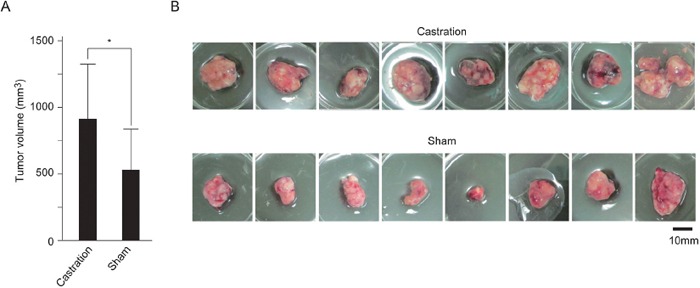
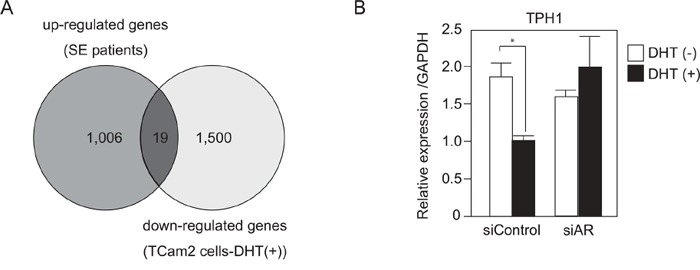
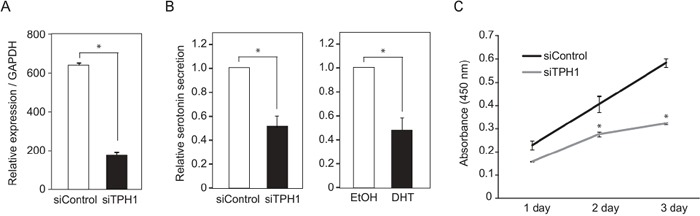
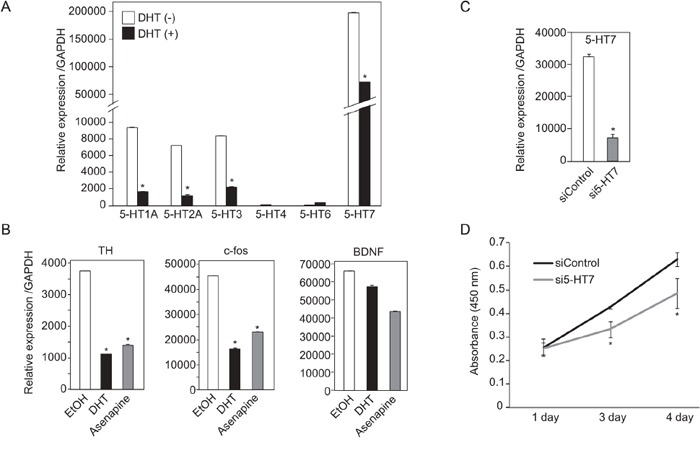
Silencing of androgen receptor (AR)-meditated androgen signaling is thought to be associated with the development of testicular germ cell tumors (TGCTs). However, the role of the androgen/AR signal in TGCT development has not been investigated. In this study, we show that the androgen/AR signal suppressed the cell growth of seminomas (SEs), a type of TGCT, in vitro and in vivo. Growth of SE cells was suppressed by DHT treatment and reduction of androgen levels by surgical castration promoted cancer cell growth in an in vivo xenograft model. Tryptophan hydroxylase 1 (TPH1), the rate limit enzyme in serotonin synthesis, was one of the genes which expression was reduced in DHT-treated SE cells. TPH1 was highly expressed in SE cancer tissues compared with adjacent normal tissues. Activation of androgen/AR signaling in SE cells reduced the expression of TPH1 in SE cells, followed by the reduction of serotonin secretion in cell culture supernatant. These results suggested that silencing of androgen/AR signaling may cause initiation and progression of SE through increase in TPH1 gene expression level.
Keywords: androgen; androgen receptor; seminoma; testicular cancer; tryptophan hydroxylase 1.
Conflict of interest statement
The authors declare no conflicts of interest.
Figures
Similar articles
-
Testis-specific protein on Y chromosome (TSPY) represses the activity of the androgen receptor in androgen-dependent testicular germ-cell tumors.Proc Natl Acad Sci U S A. 2010 Nov 16;107(46):19891-6. doi: 10.1073/pnas.1010307107. Epub 2010 Nov 1. Proc Natl Acad Sci U S A. 2010. Retraction in: Proc Natl Acad Sci U S A. 2014 Feb 11;111(6):2398. doi: 10.1073/pnas.1323399111. PMID: 21041627 Free PMC article. Retracted.
-
Androgen receptor-dependent regulation of Bcl-xL expression: Implication in prostate cancer progression.Prostate. 2008 Mar 1;68(4):453-61. doi: 10.1002/pros.20723. Prostate. 2008. PMID: 18196538
-
Aging up-regulates ARA55 in stromal cells, inducing androgen-mediated prostate cancer cell proliferation and migration.J Mol Histol. 2016 Jun;47(3):305-15. doi: 10.1007/s10735-016-9679-y. Epub 2016 May 13. J Mol Histol. 2016. PMID: 27178620
-
Androgen receptors in hormone-dependent and castration-resistant prostate cancer.Pharmacol Ther. 2013 Dec;140(3):223-38. doi: 10.1016/j.pharmthera.2013.07.003. Epub 2013 Jul 13. Pharmacol Ther. 2013. PMID: 23859952 Review.
-
Androgen action in the prostate gland.Minerva Urol Nefrol. 2012 Mar;64(1):35-49. Minerva Urol Nefrol. 2012. PMID: 22402316 Review.
Cited by
-
A testis-specific lncRNA functions as a post-transcriptional regulator of MDM2 and stimulates apoptosis of testicular germ cell tumor cells.Cell Death Discov. 2024 Aug 3;10(1):348. doi: 10.1038/s41420-024-02119-8. Cell Death Discov. 2024. PMID: 39097584 Free PMC article.
-
New insights on testicular cancer prevalence with novel diagnostic biomarkers and therapeutic approaches.Cancer Rep (Hoboken). 2024 Mar;7(3):e2052. doi: 10.1002/cnr2.2052. Cancer Rep (Hoboken). 2024. PMID: 38507271 Free PMC article. Review.
-
Hormone-Glutamine Metabolism: A Critical Regulatory Axis in Endocrine-Related Cancers.Int J Mol Sci. 2022 Sep 3;23(17):10086. doi: 10.3390/ijms231710086. Int J Mol Sci. 2022. PMID: 36077501 Free PMC article. Review.
-
COVID-19 Infection Induce miR-371a-3p Upregulation Resulting in Influence on Male Fertility.Biomedicines. 2022 Apr 6;10(4):858. doi: 10.3390/biomedicines10040858. Biomedicines. 2022. PMID: 35453608 Free PMC article.
-
Elucidation of Factors Affecting the Age-Dependent Cancer Occurrence Rates.Int J Mol Sci. 2024 Dec 31;26(1):275. doi: 10.3390/ijms26010275. Int J Mol Sci. 2024. PMID: 39796131 Free PMC article.
References
MeSH terms
Substances
LinkOut - more resources
Full Text Sources
Other Literature Sources
Medical
Research Materials
