Postembryonic Nephrogenesis and Persistence of Six2-Expressing Nephron Progenitor Cells in the Reptilian Kidney
- PMID: 27144443
- PMCID: PMC4856328
- DOI: 10.1371/journal.pone.0153422
Postembryonic Nephrogenesis and Persistence of Six2-Expressing Nephron Progenitor Cells in the Reptilian Kidney
Erratum in
-
Correction: Postembryonic Nephrogenesis and Persistence of Six2-Expressing Nephron Progenitor Cells in the Reptilian Kidney.PLoS One. 2016 Jun 1;11(6):e0156475. doi: 10.1371/journal.pone.0156475. eCollection 2016. PLoS One. 2016. PMID: 27248697 Free PMC article.
Abstract
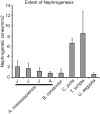
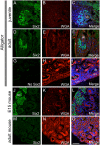
New nephron formation (nephrogenesis) ceases in mammals around birth and is completely absent in adults. In contrast, postembryonic nephrogenesis is well documented in the mesonephric kidneys of fishes and amphibians. The transient mesonephros in reptiles (including birds) and mammals is replaced by the metanephros during embryogenesis. Thus, one may speculate that postembryonic nephrogenesis is restricted to the mesonephric kidney. Previous reports have suggested the metanephros of non-avian reptiles (hereafter reptiles) may continually form nephrons throughout life. We investigated the presence of adult nephrogenesis in reptiles by examining adult kidneys from several species including Trachemys scripta, Chrysemys picta, Boa constrictor, Tupinambis tegu, Anolis carolinensis, and Alligator mississipiensis among others. We found that all major reptilian groups (Testudines, Crocodylia, and Squamates) showed the presence of adult nephrogenesis. The total amount of nephrogenesis varied greatly between species with turtles displaying the highest density of nephrogenesis. In contrast, we were unable to detect adult nephrogenesis in monotremes, and in the iguanid A. carolinensis. Nephron progenitor cells express the transcription factor Six2, which in mammals, becomes downregulated as the progenitor cell population is exhausted and nephrogenesis ends. Using the alligator as a model, we were able to detect Six2-positive cap mesenchyme cells in the adult kidney, which spatially correlated with areas of nephrogenesis. These results suggest that the metanephric kidney of reptiles has maintained the ability to continually grow new nephrons during postembryonic life, a process lost early in mammalian evolution, likely due to the persistence of a Six2-expressing progenitor cell population.
Conflict of interest statement
Figures


Similar articles
-
Prorenin receptor is critical for nephron progenitors.Dev Biol. 2016 Jan 15;409(2):382-91. doi: 10.1016/j.ydbio.2015.11.024. Epub 2015 Dec 3. Dev Biol. 2016. PMID: 26658320 Free PMC article.
-
Six2 defines and regulates a multipotent self-renewing nephron progenitor population throughout mammalian kidney development.Cell Stem Cell. 2008 Aug 7;3(2):169-81. doi: 10.1016/j.stem.2008.05.020. Cell Stem Cell. 2008. PMID: 18682239 Free PMC article.
-
Differential regulation of mouse and human nephron progenitors by the Six family of transcriptional regulators.Development. 2016 Feb 15;143(4):595-608. doi: 10.1242/dev.127175. Development. 2016. PMID: 26884396 Free PMC article.
-
Epigenetic States of nephron progenitors and epithelial differentiation.J Cell Biochem. 2015 Jun;116(6):893-902. doi: 10.1002/jcb.25048. J Cell Biochem. 2015. PMID: 25560433 Free PMC article. Review.
-
Defining and redefining the nephron progenitor population.Pediatr Nephrol. 2011 Sep;26(9):1395-406. doi: 10.1007/s00467-010-1750-4. Epub 2011 Jan 14. Pediatr Nephrol. 2011. PMID: 21229268 Free PMC article. Review.
Cited by
-
Correction: Postembryonic Nephrogenesis and Persistence of Six2-Expressing Nephron Progenitor Cells in the Reptilian Kidney.PLoS One. 2016 Jun 1;11(6):e0156475. doi: 10.1371/journal.pone.0156475. eCollection 2016. PLoS One. 2016. PMID: 27248697 Free PMC article.
-
Renal Autologous Cell Therapy to Stabilize Function in Diabetes-Related Chronic Kidney Disease: Corroboration of Mechanistic Action With Cell Marker Analysis.Kidney Int Rep. 2022 Apr 21;7(7):1619-1629. doi: 10.1016/j.ekir.2022.04.014. eCollection 2022 Jul. Kidney Int Rep. 2022. PMID: 35812284 Free PMC article.
-
mTOR Signaling at the Crossroad between Metazoan Regeneration and Human Diseases.Int J Mol Sci. 2020 Apr 14;21(8):2718. doi: 10.3390/ijms21082718. Int J Mol Sci. 2020. PMID: 32295297 Free PMC article. Review.
-
Returning to kidney development to deliver synthetic kidneys.Dev Biol. 2021 Jun;474:22-36. doi: 10.1016/j.ydbio.2020.12.009. Epub 2021 Jan 7. Dev Biol. 2021. PMID: 33333068 Free PMC article. Review.
-
Postembryonic Maintenance of Nephron Progenitor Cells with Low Translational Activity in the Chondrichthyan Scyliorhinus canicula.J Am Soc Nephrol. 2025 Apr 1;36(4):571-586. doi: 10.1681/ASN.0000000558. Epub 2024 Nov 22. J Am Soc Nephrol. 2025. PMID: 39699552
References
-
- Smith HW. The Evolution of the Kidney Lectures of the Kidney Kansas City: University of Kansas Press; 1943. p. 3–23.
-
- Drummond I. Making a zebrafish kidney: a tale of two tubes. Trends Cell Biol 2003. July;13(7):357–365. - PubMed
Publication types
MeSH terms
Substances
Grants and funding
LinkOut - more resources
Full Text Sources
Other Literature Sources
Medical
Miscellaneous

