

High-order resting-state functional connectivity network for MCI classification
- PMID: 27144538
- PMCID: PMC4980261
- DOI: 10.1002/hbm.23240
High-order resting-state functional connectivity network for MCI classification
Abstract
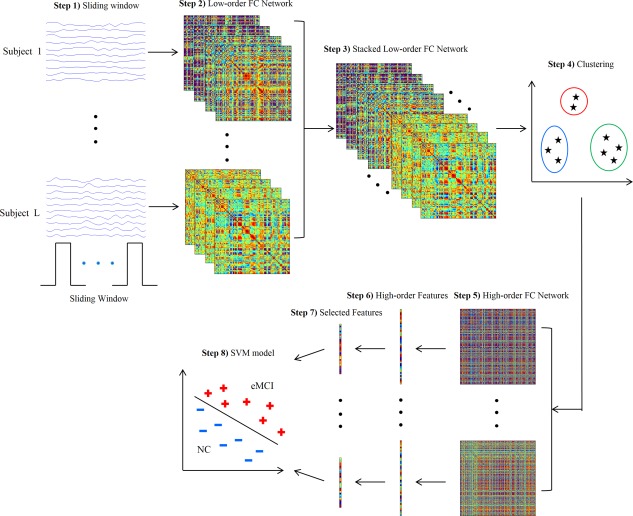
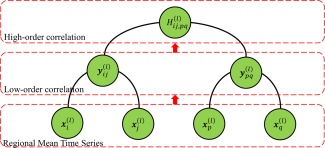
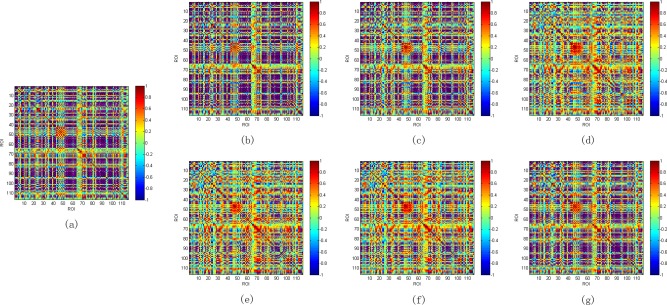
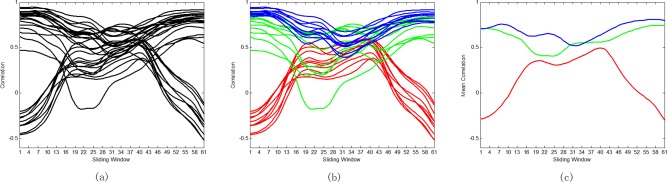
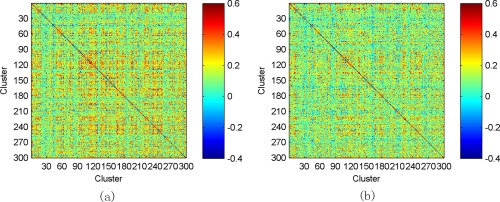
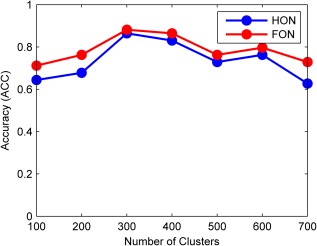
Brain functional connectivity (FC) network, estimated with resting-state functional magnetic resonance imaging (RS-fMRI) technique, has emerged as a promising approach for accurate diagnosis of neurodegenerative diseases. However, the conventional FC network is essentially low-order in the sense that only the correlations among brain regions (in terms of RS-fMRI time series) are taken into account. The features derived from this type of brain network may fail to serve as an effective disease biomarker. To overcome this drawback, we propose extraction of novel high-order FC correlations that characterize how the low-order correlations between different pairs of brain regions interact with each other. Specifically, for each brain region, a sliding window approach is first performed over the entire RS-fMRI time series to generate multiple short overlapping segments. For each segment, a low-order FC network is constructed, measuring the short-term correlation between brain regions. These low-order networks (obtained from all segments) describe the dynamics of short-term FC along the time, thus also forming the correlation time series for every pair of brain regions. To overcome the curse of dimensionality, we further group the correlation time series into a small number of different clusters according to their intrinsic common patterns. Then, the correlation between the respective mean correlation time series of different clusters is calculated to represent the high-order correlation among different pairs of brain regions. Finally, we design a pattern classifier, by combining features of both low-order and high-order FC networks. Experimental results verify the effectiveness of the high-order FC network on disease diagnosis. Hum Brain Mapp 37:3282-3296, 2016. © 2016 Wiley Periodicals, Inc.
Keywords: brain disease diagnosis; functional connectivity; low-order and high-order networks; mild cognitive impairment.
© 2016 Wiley Periodicals, Inc.
Figures
References
-
- Asrami FF (2012): Alzheimer's Disease Classification using K‐OPLS and MRI. Linköping University.
-
- Association AS (2012): 2012 Alzheimer's disease facts and figures. Alzheimer's Dement 8:131–168. - PubMed
-
- Bengio Y, Courville A, Vincent P (2013): Representation learning: A review and new perspectives. IEEE Trans Pattern Anal Mach Intell 35:1798–1828. - PubMed
-
- Bishop, C (2006): Pattern Recognition and Machine Learning. New York: Springer.
Publication types
MeSH terms
Grants and funding
LinkOut - more resources
Full Text Sources
Other Literature Sources
