. 2016 Jun;18(6):700-708.
doi: 10.1038/ncb3347. Epub 2016 May 4.

Self-organization of the human embryo in the absence of maternal tissues

Affiliations

Self-organization of the human embryo in the absence of maternal tissues

Marta N Shahbazi et al. Nat Cell Biol. 2016 Jun.

Abstract

Remodelling of the human embryo at implantation is indispensable for successful pregnancy. Yet it has remained mysterious because of the experimental hurdles that beset the study of this developmental phase. Here, we establish an in vitro system to culture human embryos through implantation stages in the absence of maternal tissues and reveal the key events of early human morphogenesis. These include segregation of the pluripotent embryonic and extra-embryonic lineages, and morphogenetic rearrangements leading to generation of a bilaminar disc, formation of a pro-amniotic cavity within the embryonic lineage, appearance of the prospective yolk sac, and trophoblast differentiation. Using human embryos and human pluripotent stem cells, we show that the reorganization of the embryonic lineage is mediated by cellular polarization leading to cavity formation. Together, our results indicate that the critical remodelling events at this stage of human development are embryo-autonomous, highlighting the remarkable and unanticipated self-organizing properties of human embryos.


Figures
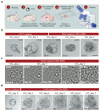
Figure 1
Figure 1. Establishment of an in vitro system to study human implantation and early post-implantation morphogenesis.
Human embryos were thawed and cultured until the blastocyst stage (day 5-6 of development). The zona pellucida was removed and embryos were transferred to plates in IVC1 medium for imaging. On the second day of culture, medium was changed for IVC2 with 30% KnockOut Serum Replacement (KSR) (b, c) or 20% human cord serum (HCS) (d). Shown are representative bright field images of human blastocysts developing in vitro until day 12-13. All scale bars, 100 μm. These data involved the assessment of a total of 5 embryos collected across 3 experiments, out of which 3 showed a correct development.
Figure 2
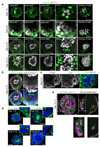
Figure 2. Preservation of the pluripotent lineage in human embryos cultured through implantation stages in vitro.
a, Bright field images of day 5-6 blastocysts. Asterisks indicate the inner cell mass. b, Day 5-6 blastocysts were fixed and immunostained for lineage markers. Representative confocal Z sections of human blastocysts stained for OCT4 and GATA6, and OCT4 and CK7. c, Human embryos cultured in either 21% or 5% O2 were analysed at indicated time points. Representative confocal Z sections of human embryos stained for OCT4, aPKC and F-actin. Note the absence of OCT4-expressing cells and the presence of fragmented nuclei in the embryos cultured in 5% O2. All scale bar, 50 μm. These data involved the assessment of a total of 59 embryos in 21% O2 (out of which 29 embryos preserved the epiblast) and 20 embryos in 5% O2 (out of which none preserved the epiblast) collected across 3 experiments.
Figure 3
Figure 3. Analysis of embryonic and extra-embryonic lineages in human embryos cultured through implantation stages in vitro.
Human embryos developing in vitro until day 11 were fixed and stained at indicated time points. a, Representative confocal Z sections of human embryos stained for OCT4 and GATA6. Right panels show the centre of all OCT4-expressing (white) and GATA6-expressing (green) cells. All positive cells were counted regardless of the fluorescence intensity value. b, Representative confocal Z section of a day 9-10 embryo stained for OCT4, GATA6 and CK7. c, Representative confocal Z section of a day 8-9 embryo stained for PAR6 and CK7. d, Representative confocal Z section of human embryos stained for F-actin and DAPI. Arrowheads point to multinucleated cells. e, 3D reconstruction of the cellular and nuclear shape of representative trophectoderm cells. Note that cells in close proximity to the epiblast have a single nucleus, whereas cells in the periphery of the embryo are multinucleated. All yellow squares indicate the regions in the embryos that are shown with higher magnification. All scale bars, 50 μm. These data involved the assessment of a total of 59 embryos collected across 6 experiments, out of which 29 showed preservation of the embryonic lineage.
Figure 4
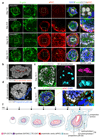
Figure 4. Remodelling of the epiblast in human embryos cultured through implantation stages.
Human embryos developing in vitro until day 11 were fixed and stained at indicated time points. a, Representative confocal Z sections of human embryos stained for F-actin, aPKC, and OCT4. Arrowheads indicate the incipient pro-amniotic cavity. b, 3D reconstruction of the pro-amniotic cavity (shown in red). The nuclei of OCT4-expressing epiblast cells is shown in gray. c, 3D reconstruction of the cellular shape of representative OCT4-expressing epiblast cells. d, 3D reconstruction of the prospective yolk sac (shown in blue). The nuclei of OCT4-expressing epiblast cells is shown in gray. e, Day 10-11 embryo stained for F-actin, OCT4, GATA6 and aPKC. Note the presence of GATA6-expressing cells on both sides of the cavity (arrowheads). The prospective yolk sac is indicated with a dashed line. f, Model of human embryo implantation morphogenesis based on our results and the Carnegie Series. The major remodelling events that take place during this transition are: (i) segregation of epiblast and hypoblast progenitors -day 7; (ii) polarisation and pro-amniotic cavity formation in the epiblast -day 8-10; (iii) differentiation of the trophectoderm into cytotrophoblast and syncytiotrophoblast cells -day 8-10; (iv) formation of the prospective amniotic epithelium, the prospective yolk sac and the bilaminar disc–day 10-11. All squares indicate the regions in the embryos that are shown with higher magnification. All scale bars, 50 μm. These data involved the assessment of a total of 59 embryos collected across 6 experiments, out of which 9 showed pro-amniotic cavity formation.
Figure 5
Figure 5. Self-organisation of hESCs in response to extracellular matrix signaling.
hESCs were plated in a 3D matrix of matrigel and analysed at the indicated time points. a, hESCs stained for OCT4 as a marker of pluripotency, aPKC as marker of apical polarisation and F-actin to reveal the general organisation of the cells. b, hESCs stained for PAR-6 and F-actin. The size of the lumen was quantified. Data is shown as average ± s.e.m. Note the increase in lumen size with time (n=10 hESC organoids per time point). Unpaired two-tailed Student’s t test with Welch’s correction, **p=0.0049. c, hESCs stained for the centrosome marker γ-Tubulin and F-actin. Arrowheads indicate the polarised apical localization of the centrosome. The nucleus centrosome angle with respect to the nucleus-nucleus axis is shown. Each dot represents an individual centrosome. Data is shown as average ± s.e.m. (n=19 centrosomes). d, hESCs stained for the Golgi marker GM130 and F-actin. Arrowheads indicate the polarised apical localization of the Golgi. All scale bars, 10 μm. These data involved the assessment of a minimum of 10 hESC organoids per panel, all of which showed the indicated phenotype. Images are representative of a minimum of 2 independent experiments per panel.
Figure 6
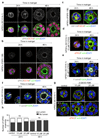
Figure 6. Self-organisation of hiPSCs in response to extracellular matrix signaling.
hiPSCs were plated in a 3D matrix of matrigel and analysed at the indicated time points. a-b, hiPSCs stained for aPKC, OCT-4 and F-actin. c, hiPSCs stained for PAR-6, GM130 and F-actin. d, hiPSCs cultured in the presence of the ROCK inhibitor Y-27632 and stained for aPKC and F-actin. e-f, hiPSCs cultured in the presence (e) or absence (f) of ROCK inhibitor, and stained for PODXL and F-actin g, hiPSCs were treated with the caspase 3 inhibitor Z-DEVD FMK and lumen formation was analysed 24 and 48 hours after plating by staining for aPKC and F-actin. h, Quantification of lumen formation in the presence of Z-DEVD FMK. Data is shown as a contingency table. Fisher’s exact test. ns: not significant (n=12 hiPSC organoids per condition -24h time point-; n=10 hiPSC organoids per condition -48h time point-). Data presented in this figure involved the assessment of a minimum of 10 hESC organoids per panel and per condition across a minimum of 2 independent experiments per panel.

Comment in

  • The Will of the Human Embryo.
    Gerhardt K. Gerhardt K. Biol Reprod. 2016 Jul;95(1):2. doi: 10.1095/biolreprod.116.142364. Epub 2016 Jun 1. Biol Reprod. 2016. PMID: 27387870 No abstract available.

References

    1. Edwards RG, Bavister BD, Steptoe PC. Early stages of fertilization in vitro of human oocytes matured in vitro. Nature. 1969;221:632–635. - PubMed
    1. Edwards RG, Steptoe PC, Purdy JM. Fertilization and cleavage in vitro of preovulator human oocytes. Nature. 1970;227:1307–1309. - PubMed
    1. Koot YE, Teklenburg G, Salker MS, Brosens JJ, Macklon NS. Molecular aspects of implantation failure. Biochim Biophys Acta. 2012;1822:1943–1950. - PubMed
    1. Enders AC, Schlafke S, Hendrickx AG. Differentiation of the embryonic disc, amnion, and yolk sac in the rhesus monkey. Am J Anat. 1986;177:161–185. - PubMed
    1. Pera MF, Trounson AO. Human embryonic stem cells: prospects for development. Development. 2004;131:5515–5525. - PubMed

Publication types