Comparative Study
. 2016 May 4;18(1):27.
doi: 10.1186/s12968-016-0242-5.

A new automatic algorithm for quantification of myocardial infarction imaged by late gadolinium enhancement cardiovascular magnetic resonance: experimental validation and comparison to expert delineations in multi-center, multi-vendor patient data

Affiliations
Comparative Study

A new automatic algorithm for quantification of myocardial infarction imaged by late gadolinium enhancement cardiovascular magnetic resonance: experimental validation and comparison to expert delineations in multi-center, multi-vendor patient data

Henrik Engblom et al. J Cardiovasc Magn Reson. .

Abstract

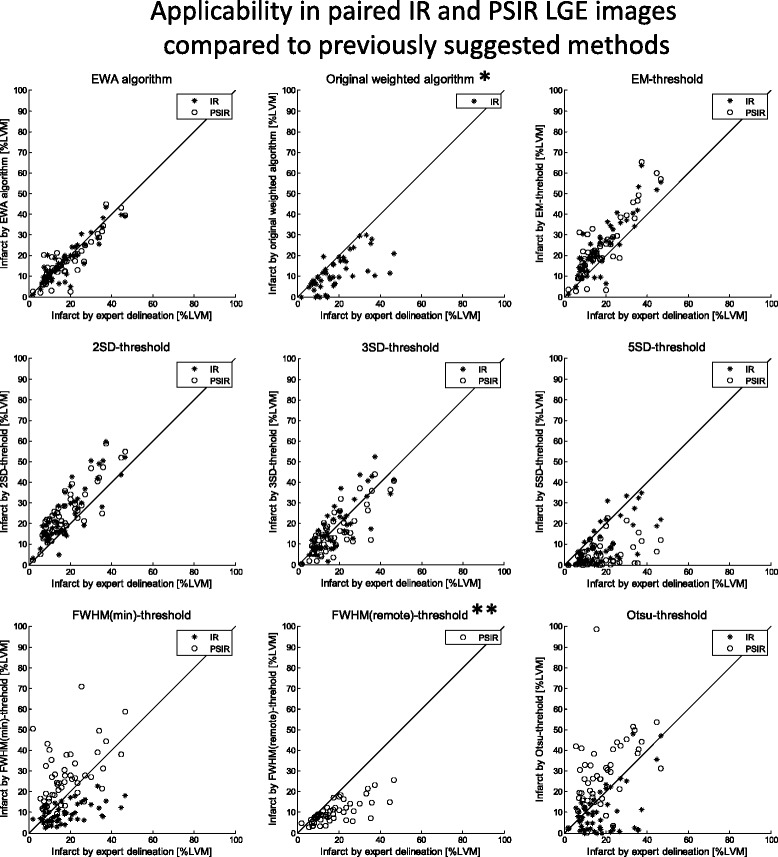
Background: Late gadolinium enhancement (LGE) cardiovascular magnetic resonance (CMR) using magnitude inversion recovery (IR) or phase sensitive inversion recovery (PSIR) has become clinical standard for assessment of myocardial infarction (MI). However, there is no clinical standard for quantification of MI even though multiple methods have been proposed. Simple thresholds have yielded varying results and advanced algorithms have only been validated in single center studies. Therefore, the aim of this study was to develop an automatic algorithm for MI quantification in IR and PSIR LGE images and to validate the new algorithm experimentally and compare it to expert delineations in multi-center, multi-vendor patient data.

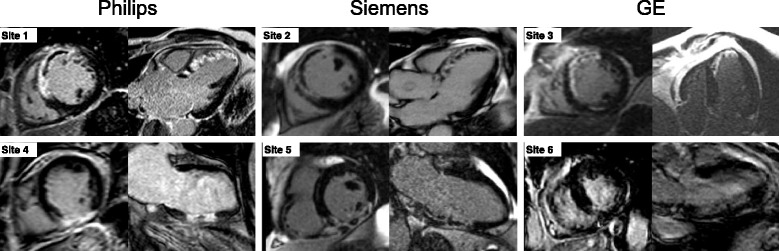
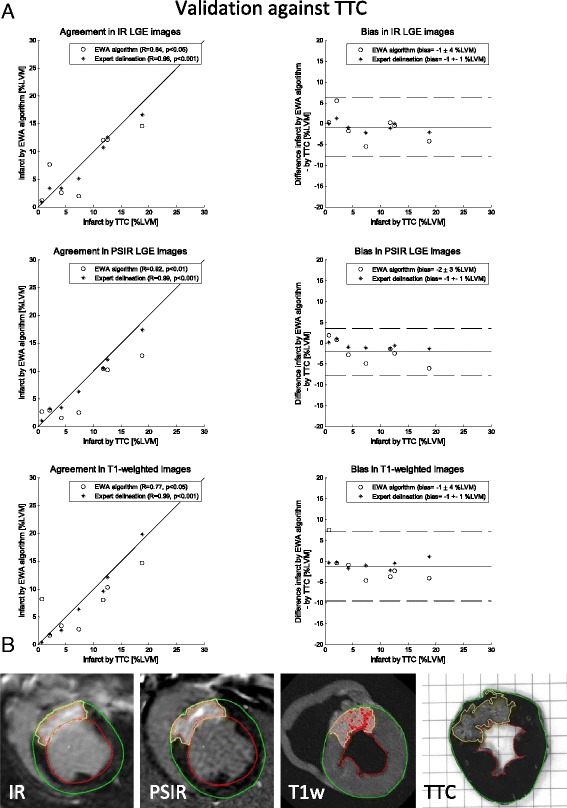
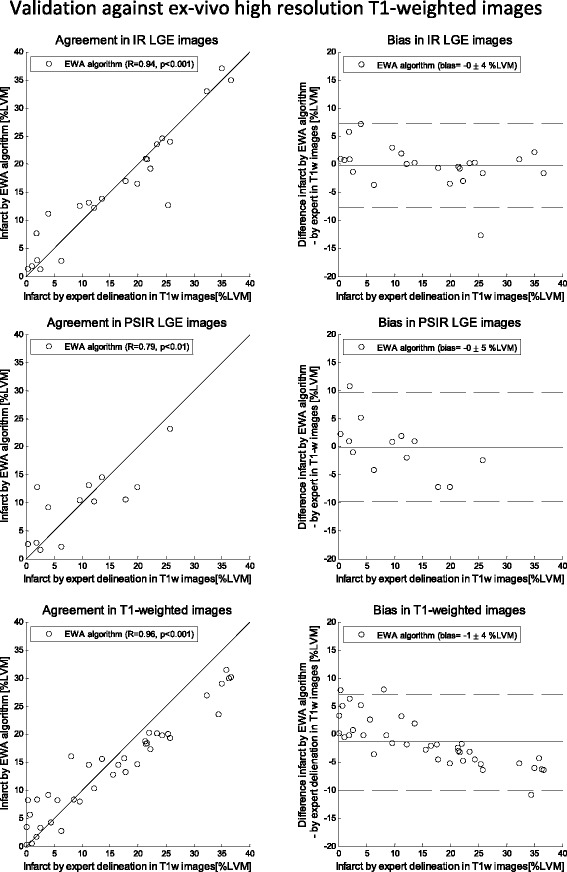
Methods: The new automatic algorithm, EWA (Expectation Maximization, weighted intensity, a priori information), was implemented using an intensity threshold by Expectation Maximization (EM) and a weighted summation to account for partial volume effects. The EWA algorithm was validated in-vivo against triphenyltetrazolium-chloride (TTC) staining (n = 7 pigs with paired IR and PSIR images) and against ex-vivo high resolution T1-weighted images (n = 23 IR and n = 13 PSIR images). The EWA algorithm was also compared to expert delineation in 124 patients from multi-center, multi-vendor clinical trials 2-6 days following first time ST-elevation myocardial infarction (STEMI) treated with percutaneous coronary intervention (PCI) (n = 124 IR and n = 49 PSIR images).

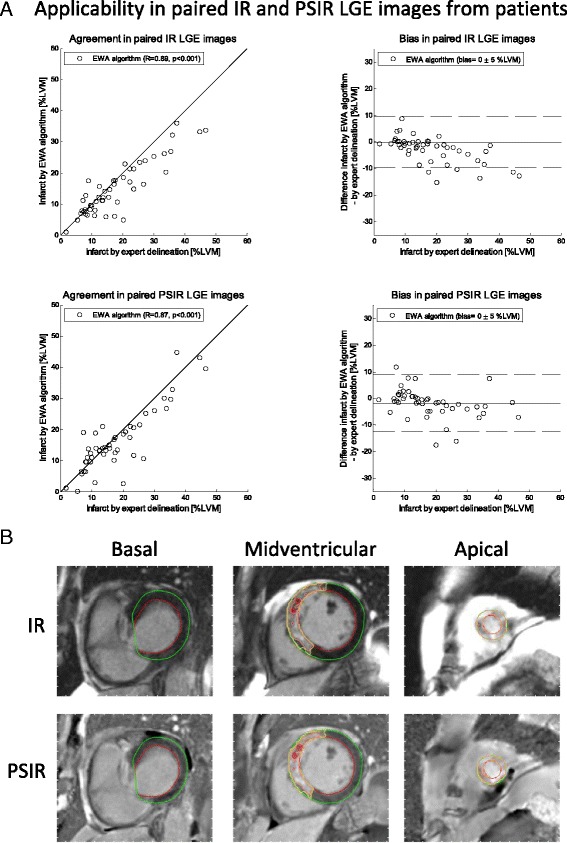
Results: Infarct size by the EWA algorithm in vivo in pigs showed a bias to ex-vivo TTC of -1 ± 4%LVM (R = 0.84) in IR and -2 ± 3%LVM (R = 0.92) in PSIR images and a bias to ex-vivo T1-weighted images of 0 ± 4%LVM (R = 0.94) in IR and 0 ± 5%LVM (R = 0.79) in PSIR images. In multi-center patient studies, infarct size by the EWA algorithm showed a bias to expert delineation of -2 ± 6 %LVM (R = 0.81) in IR images (n = 124) and 0 ± 5%LVM (R = 0.89) in PSIR images (n = 49).

Conclusions: The EWA algorithm was validated experimentally and in patient data with a low bias in both IR and PSIR LGE images. Thus, the use of EM and a weighted intensity as in the EWA algorithm, may serve as a clinical standard for the quantification of myocardial infarction in LGE CMR images.

Clinical trial registration: CHILL-MI: NCT01379261 .

Mitocare: NCT01374321 .

Keywords: Automatic quantification algorithm; Expectation maximization; Experimental validation; LGE CMR; Multi-center patient data.


Figures

Fig. 1
Fig. 1
Examples of LGE images from different sites using different vendors. Representative images (a mid-ventricular short-axis image and a long-axis image) from six different sites using either a Philips, Siemens or GE scanner. The upper panel shows images from three patients with anteroseptal infarction due to LAD occlusion. The lower panel shows images from three patients with inferior infarction due to RCA occlusion
Fig. 2
Fig. 2
Maximal extent model of perfusion territories. Bulls-eye representation of maximal extent model of the perfusion territories of left anterior descending artery (LAD), left circumflex artery (LCx), right coronary artery (RCA), and left main artery (LM). Models for LAD, LCX and RCA were defined in consensus by three experienced observers in an extended 17- segment AHA model, and models for LM were defined from the models of LAD, LCX and RCA. The 17-segment model is extended to three slices in each of the basal, mid-ventricular and apical zones and 24 sectors in each slice. Black sectors are included in the maximal extent model. The septal part of the left ventricle was represented in the left of the bulls-eye plot, the lateral part in the right, anterior part in the top, inferior part in the bottom, the apical slices in the center and the basal slices in the outer part of the bulls-eye plot
Fig. 3
Fig. 3
Validation against TTC: a Scatter plots (left column) and Bland-Altman plots (right column) of infarct size expressed as % of left ventricular mass (%LVM) for the EWA algorithm against infarct size by triphenyltetrazolium-chloride (TTC) in pigs with myocardial infarction imaged after seven days (n = 7) with in-vivo magnitude inversion recovery LGE images (IR, top row), in-vivo phase sensitive inversion recovery LGE images (PSIR, middle row) and ex-vivo high resolution T1-weighted images (T1w, bottom row). Left column: solid line = line of identity; dashed line = regression line. Right column: solid line = mean bias; dashed line = mean ± two standard deviations. b Infarct segmentation by the EWA algorithm in one pig shown in one slice of in-vivo IR LGE, in-vivo PSIR LGE, ex-vivo high resolution T1w and corresponding TTC-stained slice. Infarct segmentation by the EWA algorithm and by manual delineation in TTC images is shown in yellow. For the automatic EWA segmentation the core of the infarct is shown in pink and microvascular obstruction is shown as the red line within the infarct. Endocardium is delineated in red and epicardium in green
Fig. 4
Fig. 4
Validation against ex-vivo high resolution T1-weighted images: Scatter plots (left column) and Bland-Altman plots (right column) of infarct size expressed as % of left ventricular mass (%LVM) for the EWA algorithm against infarct size by expert delineation in ex-vivo high resolution T1-weighted images (T1w). Validation in in-vivo magnitude inversion recovery (IR, top row, n = 23 pigs), in-vivo phase sensitive inversion recovery (PSIR, middle row, n = 13) and ex-vivo high resolution T1-weighted images (T1w, bottom row, n = 38). Left column: solid line = line of identity; dashed line = regression line. Right column: solid line = mean bias; dashed line = mean ± two standard deviations
Fig. 5
Fig. 5
Applicability in paired IR and PSIR LGE images from patients in multi-center, multi-vendor studies: a Scatter plots (left column) and Bland-Altman plots (right column) of infarct size expressed as % of LVM for the EWA algorithm against infarct size by expert delineation in 49 patients from multi-center studies with paired magnitude inversion recovery (IR, top row) and phase sensitive inversion recovery LGE images (PSIR, bottom row). Left column: solid line = line of identity; dashed line = regression line. Right column: solid line = mean bias; dashed line = mean ± two standard deviations. b Typical segmentation by the EWA algorithm in one patient with paired IR (top row) and PSIR images (bottom row). The automatic EWA segmentation of the infarct is shown in yellow, the core of the infarct is shown in pink and microvascular obstruction is shown as the red line within the infarct. Endocardium is delineated in red and epicardium in green
Fig. 6
Fig. 6
Applicability in paired IR and PSIR LGE images from multi-center patient studies compared to previously suggested methods for MI quantification: Scatter plots of infarct size expressed as % of left ventricular mass (% LVM) against infarct size by expert delineation in 49 patients for the EWA algorithm, the original weighted algorithm [14] and the threshold method of Expectation Maximization (EM) [15] (top row), 2SD, 3SD and 5SD from remote (middle row), and FWHM from minimum intensity [8], FWHM from mean intensity in remote [12] and Otsu's threshold [26] (bottom row) in paired magnitude inversion recovery (IR) and phase sensitive inversion recovery (PSIR) LGE images. Solid lines = line of identity. * the original weighted algorithm by Heiberg et al. [14] was developed for IR images and therefore only applied in IR images. ** the FWHM remote threshold was developed for PSIR images as part of the FACT algorithm by Hsu et al. [12] and therefore only applied in PSIR images

References

    1. Kim RJ, Fieno DS, Parrish TB, Harris K, Chen EL, Simonetti O, et al. Relationship of MRI delayed contrast enhancement to irreversible injury, infarct age, and contractile function. Circulation. 1999;100(19):1992–2002. doi: 10.1161/01.CIR.100.19.1992. - DOI - PubMed
    1. Fieno DS, Kim RJ, Chen EL, Lomasney JW, Klocke FJ, Judd RM. Contrast-enhanced magnetic resonance imaging of myocardium at risk: distinction between reversible and irreversible injury throughout infarct healing. J Am Coll Cardiol. 2000;36(6):1985–91. doi: 10.1016/S0735-1097(00)00958-X. - DOI - PubMed
    1. Wesbey GE, Higgins CB, McNamara MT, Engelstad BL, Lipton MJ, Sievers R, et al. Effect of gadolinium-DTPA on the magnetic relaxation times of normal and infarcted myocardium. Radiology. 1984;153(1):165–9. doi: 10.1148/radiology.153.1.6473778. - DOI - PubMed
    1. Simonetti OP, Kim RJ, Fieno DS, Hillenbrand HB, Wu E, Bundy JM, et al. An improved MR imaging technique for the visualization of myocardial infarction. Radiology. 2001;218(1):215–23. doi: 10.1148/radiology.218.1.r01ja50215. - DOI - PubMed
    1. Kellman P, Arai AE, McVeigh ER, Aletras AH. Phase-sensitive inversion recovery for detecting myocardial infarction using gadolinium-delayed hyperenhancement. Magn Reson Med. 2002;47(2):372–83. doi: 10.1002/mrm.10051. - DOI - PMC - PubMed

MeSH terms

Associated data