Review
. 2016 May 5;20(1):129.
doi: 10.1186/s13054-016-1293-6.

Regulation of the cerebral circulation: bedside assessment and clinical implications

Affiliations
Review

Regulation of the cerebral circulation: bedside assessment and clinical implications

Joseph Donnelly et al. Crit Care. .

Abstract

Regulation of the cerebral circulation relies on the complex interplay between cardiovascular, respiratory, and neural physiology. In health, these physiologic systems act to maintain an adequate cerebral blood flow (CBF) through modulation of hydrodynamic parameters; the resistance of cerebral vessels, and the arterial, intracranial, and venous pressures. In critical illness, however, one or more of these parameters can be compromised, raising the possibility of disturbed CBF regulation and its pathophysiologic sequelae. Rigorous assessment of the cerebral circulation requires not only measuring CBF and its hydrodynamic determinants but also assessing the stability of CBF in response to changes in arterial pressure (cerebral autoregulation), the reactivity of CBF to a vasodilator (carbon dioxide reactivity, for example), and the dynamic regulation of arterial pressure (baroreceptor sensitivity). Ideally, cerebral circulation monitors in critical care should be continuous, physically robust, allow for both regional and global CBF assessment, and be conducive to application at the bedside. Regulation of the cerebral circulation is impaired not only in primary neurologic conditions that affect the vasculature such as subarachnoid haemorrhage and stroke, but also in conditions that affect the regulation of intracranial pressure (such as traumatic brain injury and hydrocephalus) or arterial blood pressure (sepsis or cardiac dysfunction). Importantly, this impairment is often associated with poor patient outcome. At present, assessment of the cerebral circulation is primarily used as a research tool to elucidate pathophysiology or prognosis. However, when combined with other physiologic signals and online analytical techniques, cerebral circulation monitoring has the appealing potential to not only prognosticate patients, but also direct critical care management.


Figures
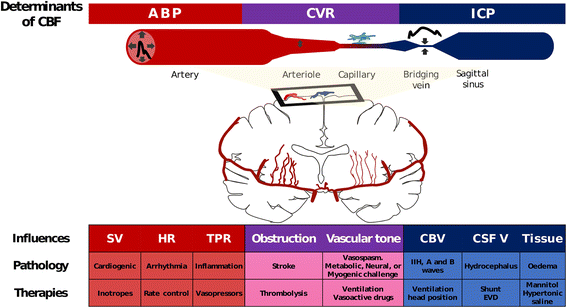
Fig. 1
Fig. 1
Regulation of the cerebral circulation. CBF at the level of the microvasculature is directly proportional to CPP (difference between ABP and ICP) and inversely proportional to CVR. ICP exerts its effect on CBF through changes in CPP; compression of the venous vasculature where the bridging veins enter the sagittal sinus ensures that the bridging vein and post-capillary intravascular pressure is always above ICP. CBF is modulated by the cardiovascular system in terms of the regulation of SV, HR, and TPR (red). Control of TPR with vasopressors forms an integral part of many CBF protective strategies (even when TPR is not the primary cause of CBF disturbance). CVR is regulated at the level of the arterioles (purple) by variations in vascular tone in response to metabolic, neural, or myogenic inputs. In ischaemic stroke or vasospasm, CVR is dramatically increased, usually at the level of large intracranial arteries. ICP (blue) modulates CBF through its coupling with cerebral venous pressure. ICP increases can be caused by increases in cerebral blood volume (arterial or venous), increased CSF volume or increase in parenchyma (oedema), or abnormal material volume (mass lesion). All therapies that modulate CBF do so via one (or more) of these pathways. There is typically significant interdependence between the therapies, determinants, and influences of CBF. For example, a drop in ABP would be expected to result in a drop in CBF but this is short lived due to the baroreflex (HR increase in response to drop in ABP) and cerebral autoregulation (decrease in vascular tone in response to drop in ABP). ABP arterial blood pressure, CBF cerebral blood flow, CBV cerebral blood volume, CSF V cerebrospinal fluid volume, CVR cerebrovascular resistance, EVD external ventricular drainage, HR heart rate, ICP intracranial pressure, IIH idiopathic intracranial hypertension, SV stroke volume, TPR total peripheral resistance
Fig. 2
Fig. 2
CO2 reactivity after TBI. CO2 reactivity is a measure indicating how well vascular responses in the brain are preserved. Mild hyperventilation (PaCO2 challenge from 35 to 31.5 mmHg) is applied temporarily (1 h) in the patient after TBI. Right CBF velocity (FVR) in the middle cerebral artery decreased from 120 to 100 cm/s. CO2 reactivity is calculated as ∆CBF velocity (%)/∆ PaCO2 and in this case reactivity is ~ 5 %/mmHg—very good. However, at the same time ICP decreased from 32 to 27 mmHg and blood pressure (ABP) increased from 120 to 125 mmHg. Therefore, CPP increased from 88 to 98 mmHg. The formula for cerebrovascular CO2 reactivity does not take into account the possible interaction between chemoregulation and autoregulation. ABP arterial blood pressure, ICP intracranial pressure
Fig. 3
Fig. 3
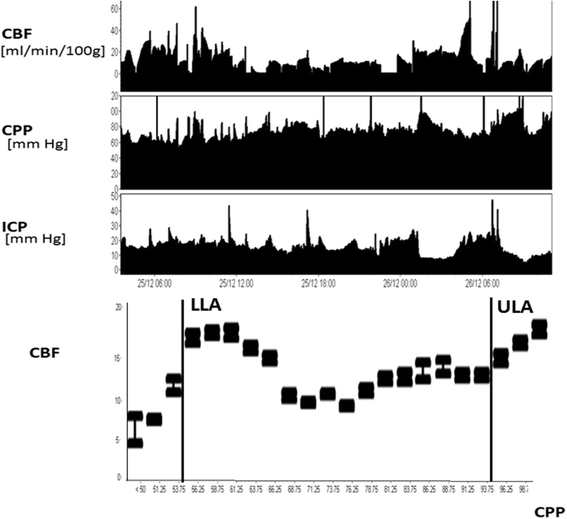
Long-term invasive CBF and CPP monitoring. Example of the ‘Lassen curve’ depicting the relationship between CPP and CBF. It is derived from a long-term plot of thermal-dilution CBF and CPP monitored in a patient after severe brain injury. The curve shows lower (LLA) and upper (ULA) limits of autoregulation, outside which CBF is pressure passive. Notably, within the autoregulation range, CBF is not ideally stable but shows an increase in CBF around the LLA, which is commonly observed in patients under mild hyperventilation (in this case PaCO2 was on average 32 mmHg). CBF cerebral blood flow, CPP cerebral perfusion pressure, ICP intracranial pressure
Fig. 4
Fig. 4
Cerebral perfusion monitoring in SAH. On day 3 after ictus (top 4 panels), this patient with SAH from an aneurysm of the middle cerebral artery displays a normal middle cerebral artery Fv (~60 cm/s) and intact autoregulation (TOxa and Mxa ~0 (suffix ‘a’ indicates that ABP is used instead of CPP)). On day 7 (bottom 4 panels) a marked increase in Fv (to 120 cm/s) can be seen, which is accompanied by an impairment in autoregulation (TOxa and Mxa close to 0). The transient hyperaemic response test also failed to show an increase in Fv after the release of occlusion, an indicator of impaired cerebral autoregulation. ABP arterial blood pressure, Fv flow velocity, Mxa mean flow index (with ABP), TOxa total oxygenation reactivity index (with ABP)
Fig. 5
Fig. 5
Continuous cerebral autoregulation monitoring during refractory intracranial hypertension. Continuous monitoring of cerebral autoregulation using PRx in a patient after severe TBI, who died after 6 days because of refractory intracranial hypertension. During the first 3 days ICP was stable, around 20 mmHg. However, PRx showed good autoregulation only during the first day (PRx <0.3). Later PRx was consistently above 0.5 even if ICP, CPP, and brain tissue oxygenation (PbtiO 2) were satisfactory. After day 4, PRx was persistently elevated to >0.7. On day 6, ICP increased abruptly to 70 mmHg, CPP fell to 20 mmHg, and oxygen tension fell below 5 mmHg. The patient died in a scenario of brain-stem herniation. The only parameter which deteriorated early in this case was the index of cerebral autoregulation PRx. ABP arterial blood pressure, CPP cerebral perfusion pressure, ICP intracranial pressure, PRx pressure reactivity index
Fig. 6
Fig. 6
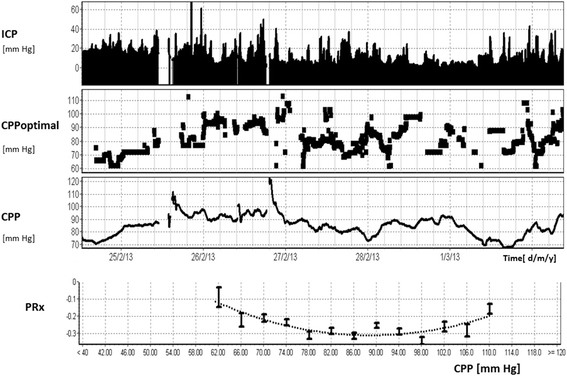
Long-term monitoring of PRx in a patient after TBI. ICP was first elevated to 20 mmHg and then decreased, showing some fluctuations over 7 days of monitoring. PRx had parabolic distribution along the recorded range of CPP (from 60 to 100 mmHg). The minimum of this parabola indicates ‘optimal CPP’ from the whole 7-day period (90 mmHg in this case—as compared with above 65–70 mmHg, advised by guidelines—which illustrates well that CPP-oriented management must be individualised; it is not true that one shoe size is good for everybody). Moreover, such a fitting of an ‘optimal curve’ may be repeated in time, based on data from the past 4 h. This enables prospective detection and tracing of ‘optimal CPP’ and targeting current CPP at its current optimal value, which may change in a course of intensive care. CPP cerebral perfusion pressure, ICP intracranial pressure, PRx pressure reactivity index
Fig. 7
Fig. 7
Monitoring of cerebral autoregulation during cardiopulmonary bypass surgery (re-analysis of raw data recording reported by Brady et al. [100]). TCD-derived autoregulation index Mxa fluctuates seemingly in a chaotic manner during surgery (period of laminar flow is denoted by near-zero pulse amplitude of the Fv waveform). However, its distribution along recorded blood pressure values resembles a parabolic curve—the same as seen in TBI patients—with its minimum indicating hypothetical ‘optimal’ blood pressure (in this case 96 mmHg). Adapted with permission of Prof. Charles Hogue and co-workers (John Hopkins Medical University) [100]. ABP arterial blood pressure, Fv flow velocity, Mxa mean flow index (with ABP)

References

    1. Ursino M, Lodi CA. A simple mathematical model of the interaction between intracranial pressure and cerebral hemodynamics. J Appl Physiol. 1997;82:1256–69. - PubMed
    1. Czosnyka M, Piechnik S, Richards HK, Kirkpatrick P, Smielewski P, Pickard JD. Contribution of mathematical modelling to the interpretation of bedside tests of cerebrovascular autoregulation. J Neurol Neurosurg Psychiatry. 1997;63:721–31. doi: 10.1136/jnnp.63.6.721. - DOI - PMC - PubMed
    1. Roy CS, Sherrington CS. On the regulation of the blood-supply of the brain. J Physiol. 1890;11:85–158. doi: 10.1113/jphysiol.1890.sp000321. - DOI - PMC - PubMed
    1. Cavus E, Bein B, Dörges V, Stadlbauer K-H, Wenzel V, Steinfath M, Hanss R, Scholz J. Brain tissue oxygen pressure and cerebral metabolism in an animal model of cardiac arrest and cardiopulmonary resuscitation. Resuscitation. 2006;71:97–106. doi: 10.1016/j.resuscitation.2006.03.007. - DOI - PubMed
    1. Bowton DL, Bertels NH, Prough DS, Stump DA. Cerebral blood flow is reduced in patients with sepsis syndrome. Crit Care Med. 1989;17:399–403. doi: 10.1097/00003246-198905000-00004. - DOI - PubMed

MeSH terms