Review
. 2016 Jul 8:39:347-84.
doi: 10.1146/annurev-neuro-061010-113708. Epub 2016 Apr 25.

New Perspectives on Genomic Imprinting, an Essential and Multifaceted Mode of Epigenetic Control in the Developing and Adult Brain

Affiliations
Review

New Perspectives on Genomic Imprinting, an Essential and Multifaceted Mode of Epigenetic Control in the Developing and Adult Brain

Julio D Perez et al. Annu Rev Neurosci. .

Abstract

Mammalian evolution entailed multiple innovations in gene regulation, including the emergence of genomic imprinting, an epigenetic regulation leading to the preferential expression of a gene from its maternal or paternal allele. Genomic imprinting is highly prevalent in the brain, yet, until recently, its central roles in neural processes have not been fully appreciated. Here, we provide a comprehensive survey of adult and developmental brain functions influenced by imprinted genes, from neural development and wiring to synaptic function and plasticity, energy balance, social behaviors, emotions, and cognition. We further review the widespread identification of parental biases alongside monoallelic expression in brain tissues, discuss their potential roles in dosage regulation of key neural pathways, and suggest possible mechanisms underlying the dynamic regulation of imprinting in the brain. This review should help provide a better understanding of the significance of genomic imprinting in the normal and pathological brain of mammals including humans.

Keywords: behavior; energy balance; gene dosage; genomic imprinting; neural development; parental bias.


Figures

Figure 1
Figure 1
Roles of imprinted genes during cortical neurogenesis. Genes preferentially expressed from the maternal and paternal allele appear in red and blue, respectively. In black are imprinted genes that are biallelically expressed in this context. Strongly biased and monoallelically expressed imprinted genes are in bold. Lines with arrowheads indicate enhancement, and lines with notched ends indicate reduction of the biological function. The asterisks by Mir379–410 indicate that the corresponding biological functions are regulated by three miRNAs of this cluster: Mir369-3p, Mir496, and Mir543.
Figure 2
Figure 2
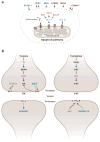
Functions of imprinted genes in synaptic transmission and plasticity. Products of genes preferentially expressed from the maternal and paternal allele appear in red and blue, respectively. Products of biallelically expressed genes appear in dark gray. Products of strongly biased and monoallelically expressed imprinted genes are in bold. Lines with arrowheads represent stimulatory molecular interactions, whereas lines with notched ends represent inhibitory molecular interactions. The overall role of imprinted genes in synaptic plasticity is shown in green to indicate synaptic potentiation or activation, in pink to indicate synaptic depression or inhibition, in blue to indicate the induction of structural changes, and in brown when the contribution to synaptic transmission or plasticity remains unclear. White-filled circles with beige borders represent vesicles containing membrane receptors or channels.
Figure 3
Figure 3
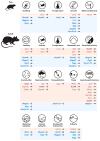
Mouse phenotypes influenced by imprinted genes. Genes associated with specific metabolic, social, emotional, and cognitive phenotypes are listed. Genes preferentially expressed from the maternal and paternal allele appear in red and blue, respectively. Strongly biased and monoallelically expressed imprinted genes are in bold. Lines with arrowheads and notched ends indicate stimulation and inhibition, respectively, of the given phenotype, whereas lines with square ends indicate functions that cannot be defined as enhancement or reduction.
Figure 4
Figure 4
Monoallelic and parentally biased genes in mouse. (a) Cumulative increase in the number of imprinted genes reported in the literature. (b) The distribution of parental allelic expression ratios of clustered and isolated imprinted genes in the developing and adult cerebellum. Figure adapted from Perez et al. (2015).
Figure 5
Figure 5
Regulation of parentally biased imprinted genes in mouse. (a) Spatial regulation of imprinting represented by a hierarchically clustered heat map of the deviation from biallelic gene expression. Panel adapted from Perez et al. (2015). L and S subscripts in the gene names indicate long and short isoforms, respectively, and V2 indicates variant 2 splice form. Acronyms of brain regions (color coded according to their broad developmental relatedness): AC, anterior cortex; CA, cortical amygdala; Cb, cerebellum; CP, caudate putamen; DM, dorsal midbrain; Hp, hippocampus; Hy, hypothalamus; My, medulla; NA, nucleus accumbens; OB, olfactory bulb; Pa, pallidum; PC, posterior cortex; Po, pons; SA, striatum-like amygdala; Th, thalamus; VM, ventral midbrain. Acronyms of nonbrain tissues: Hr, heart; Kd, kidney; Lu, lung; Lv, liver; Mu, muscle; Sk, skin; Sp, spleen. (b) Models providing the single cell–level bases for the parental biases observed in tissue homogenates. Each circle represents a single cell within the homogenized tissue. Red represents maternal expression, and blue represents paternal expression. In model 1, parental biases are identically present in each individual cell. In model 2, parental biases result from a mixture of cells exhibiting monoallelic expression with cells exhibiting biallelic expression. In model 3, parental biases result from a mixture of cells that monoallelically express either the maternal or paternal allele. (c) Age fold change {developing (P8) and adult (P60) cerebella [ln(P8/P60)]} in the magnitude of parental biases versus their age fold change in overall expression level. Panel adapted from Perez et al. (2015). Most genes exhibiting significant age-dependent changes in parental biases also show significant changes in overall expression, with the largest effects for both categories observed during development (Pearson correlation coefficient = 0.33; P = 4 × 10⁻⁴). Age-regulated imprinted genes are represented by green circles (those located near the origin show weak yet statistically significant age effects), and age-invariant imprinted genes are represented by brown circles.
Figure 6
Figure 6
Parentally biased and strongly imprinted genes are enriched in two biological pathways in the brain. (a) Regulation of apoptosis. Within the circle are products of imprinted genes that interact directly with the apoptosis machinery, and outside the circle are products of imprinted genes that influence pro- or antiapoptosis. L and S subscripts in the gene names indicate long and short isoforms, respectively. (b) Brain monoaminergic pathway. Genes preferentially or exclusively expressed from the maternal and paternal allele appear in red and blue, respectively. Products of strongly biased or monoallelically expressed genes are in bold. Lines with arrowheads and lines with notched ends indicate stimulation and inhibition, respectively, of the given phenotype, whereas lines with square ends indicate functions that cannot be defined as enhancement or reduction. Full lines indicate direct interactions, whereas dashed lines indicate indirect effect. Abbreviations: 5-HT, serotonin; 5-HT2CR, 5-HT2C receptor; D1/5, dopamine receptor 1 or 5; D2R, dopamine receptor 2; DA, dopamine; DAT, dopamine transporter; DDC, DOPA decarboxylase; TH, tyrosine hydroxylase.
Figure 7
Figure 7
Mechanistic models of parentally biased expression. (a) The decay of parental bias of imprinted genes as a function of their relative linear genomic distance from an imprinted cluster center (which is defined as the location of the monoallelically expressed imprinted genes in the cluster) in the cerebellum. The regression line is shown in magenta, and the gray shading indicates corresponding standard errors (Perez et al. 2015). (b) Known mechanisms of genomic imprinting in the mouse Kcnq1 imprinted cluster and their potential extrapolation to mechanisms of parental biases. The Kcnq1 intergenic, maternally methylated gDMR induces paternal-specific expression of Kcnq1ot1, an lncRNA that orchestrates imprinting of multiple genes at both ends of this cluster (Mancini-Dinardo et al. 2006, Terranova et al. 2008). In the placenta, genes closer to the gDMR, such as Cdkn1c, are monoallelically expressed in a DNA methylation–dependent manner (indicated by filled hexagons on top of gene bodies), whereas genes at the cluster periphery, such as Cd81 and Osbpl5, exhibit DNA methylation–independent maternal biases (red shading) (Lewis et al. 2004, Umlauf et al. 2004). Another peripheral gene, Nap1l4, is biallelically expressed ( green shading). Imprinting in these maternally biased genes is dependent on interactions between their respective promoters and Kcnq1ot1 transcripts, which recruit HMTs and PRC2, forming a contracted nuclear domain (Pandey et al. 2008, Terranova et al. 2008). Importantly, KCNQ1OT1 lncRNA does not interact with the Nap1l4 promoter. We suggest a potential model explaining parentally biased expression in this cluster (depicted on top) where the effective concentration or activity of the KCNQ1OT1 lncRNA across the length of the cluster may exhibit a normal distribution centered in its transcriptional site that decreases gradually toward the ends. In this model, the differences in KCNQ1OT1 lncRNA concentration or activity may explain its different actions in central and peripheral genes. Abbreviations: gDMR, germ-line differentially methylated region; HMT, histone methyltransferase; lncRNA, long noncoding RNA; PRC2, polycomb repressive complex 2.

Similar articles

Cited by

References

    1. Abreu AP, Dauber A, Macedo DB, Noel SD, Brito VN, et al. Central precocious puberty caused by mutations in the imprinted gene MKRN3. N Engl J Med. 2013;368(26):2467–75. - PMC - PubMed
    1. Ahuja R, Pinyol R, Reichenbach N, Custer L, Klingensmith J, et al. Cordon-bleu is an actin nucleation factor and controls neuronal morphology. Cell. 2007;131(2):337–50. - PMC - PubMed
    1. Ainsley JA, Drane L, Jacobs J, Kittelberger KA, Reijmers LG. Functionally diverse dendritic mRNAs rapidly associate with ribosomes following a novel experience. Nat Commun. 2014;5:4510. - PMC - PubMed
    1. Al Adhami H, Evano B, Le Digarcher A, Gueydan C, Dubois E, et al. A systems-level approach to parental genomic imprinting: The imprinted gene network includes extracellular matrix genes and regulates cell cycle exit and differentiation. Genome Res. 2015;25:353–67. - PMC - PubMed
    1. Albrecht U, Sutcliffe JS, Cattanach BM, Beechey CV, Armstrong D, et al. Imprinted expression of the murine Angelman syndrome gene, Ube3a, in hippocampal and Purkinje neurons. Nat Genet. 1997;17(1):75–78. - PubMed

Publication types

LinkOut - more resources