Review
. 2016 Jul 8:39:237-56.
doi: 10.1146/annurev-neuro-070815-013851. Epub 2016 Apr 21.

Correlations and Neuronal Population Information

Affiliations
Review

Correlations and Neuronal Population Information

Adam Kohn et al. Annu Rev Neurosci. .

Abstract

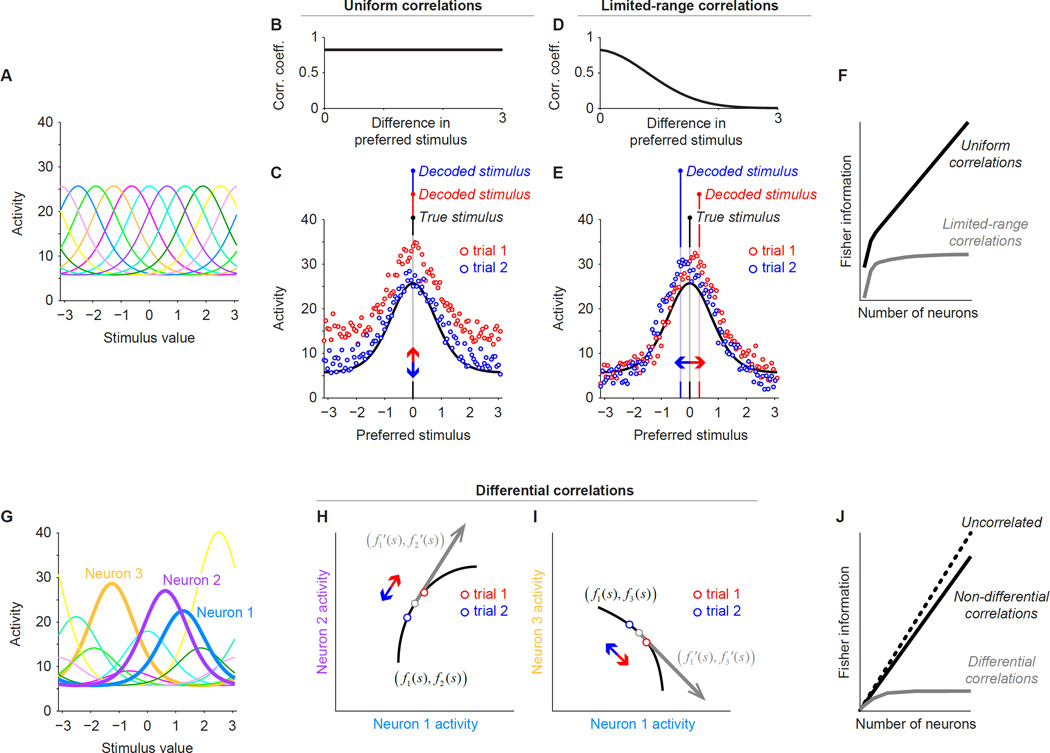
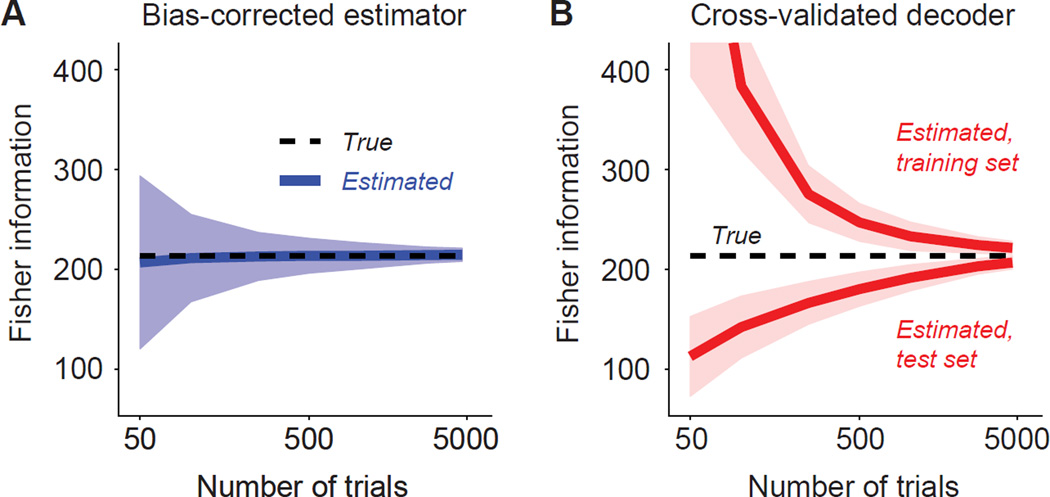
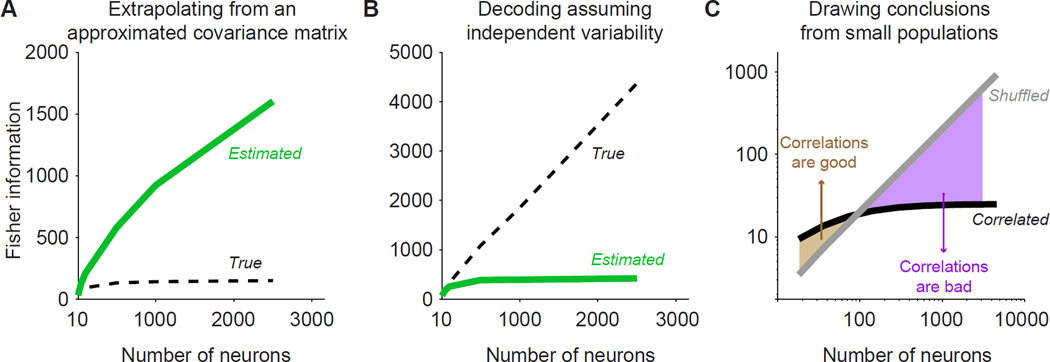
Brain function involves the activity of neuronal populations. Much recent effort has been devoted to measuring the activity of neuronal populations in different parts of the brain under various experimental conditions. Population activity patterns contain rich structure, yet many studies have focused on measuring pairwise relationships between members of a larger population-termed noise correlations. Here we review recent progress in understanding how these correlations affect population information, how information should be quantified, and what mechanisms may give rise to correlations. As population coding theory has improved, it has made clear that some forms of correlation are more important for information than others. We argue that this is a critical lesson for those interested in neuronal population responses more generally: Descriptions of population responses should be motivated by and linked to well-specified function. Within this context, we offer suggestions of where current theoretical frameworks fall short.

Keywords: Fisher information; decoding; neural coding; neural variability; perception; theoretical neuroscience.


Figures

Figure 1
Figure 1. How different forms of correlations affect information
(a) A homogeneous neuronal population, having identical tuning except for the preferred stimulus value (arbitrary units). (b) Uniform correlation structure, in which all neurons are equally correlated regardless of preference. (c) Population activity in two individual trials (red and blue circles) in response to a stimulus value of 0. Neurons are sorted by their preferred stimulus value (abscissa). The trial-averaged response is shown by the black line. Additive noise that is positively correlated across all units produces vertical shifts of the population hill of activity. In a large population, such fluctuations can be averaged out entirely by using the optimal decoder; therefore, in each trial, the decoded stimulus value is identical to the true value. (d) Limited-range correlation structure, in which neurons with similar preferences are more strongly correlated. Note that correlation magnitude is unrealistically large to visualize clearly its effect on population activity. (e) Limited-range correlations distort the population activity profile in a way that cannot be averaged out, leading to variable estimates of the stimulus value. Conventions as in panel c. (f) Fisher information as a function of population size for uniform (black) and limited-range (gray) correlations. (g) A neuronal population with heterogeneous tuning. (h) The activity of two neurons, plotted against each other. The black line indicates the average responses evoked in these neurons by a range of stimuli, defined by their tuning; the gray arrow indicates the derivative of this tuning. Differential correlations correspond to variability that changes the neural responses across trials (red and blue circles) along the direction parallel to the tuning curve derivative (red and blue arrows). For these two neurons, the derivatives have the same sign; hence, the differential correlations are positive. (i) Same as panel h, but for neurons that have derivatives with opposite signs; hence, the differential correlations are negative. (j) A graphical representation of the fact that linear Fisher information increases linearly with the number of neurons in an independent population (dashed line) and with some types of nondifferential correlations (black, continuous line), but with different slopes. Information saturates to a finite value with differential correlations (gray line).
Figure 2
Figure 2. Estimating Fisher information from population recordings
Two estimators of Fisher information are shown that accurately capture the information present in a neuronal population. Simulations are based on 50 neurons and 200 experiments, where each experiment involves a different set of parameters for the filters representing each neuron. (a) The direct estimator with analytical bias correction (blue line) provides an unbiased estimate of the true information (dotted line). Shaded areas represent ±1 standard deviation of the estimate. (b) The performance of a trained decoder on left-out data (test set) provides a lower bound on the true information and approaches the true information when there are a sufficient number of trials. Both panels from Kanitscheider et al. 2015a.
Figure 3
Figure 3. Common errors in estimating information
(a) Information in neural data can be severely misestimated when based on simulated data that approximate measured responses. Consider a synthetic population with differential correlations. For each population size N (abscissa), the true information is computed from the full population (dashed line) and shows clear saturation for large populations. The information estimated using an approximation to the true covariance matrix (green line) shows no saturation, yielding estimates that vastly exceed the true information. The estimated covariance matrix is constructed as in Moreno-Bote et al. (2014), figure 7a. Briefly, half the entries in the matrix are set to the measured value; the remaining entries are filled in by resampling the measured coefficients and enforcing that the resulting matrix is a covariance and that it has the same limited-range structure as the original data. (b) Suboptimal decoding can severely underestimate the true information in the population. Consider a heterogeneous population without differential correlations (model of Ecker et al. 2011). The true information grows with population size (dashed line); the information estimated by a suboptimal, factorized decoder (green line) saturates, underestimating the true information. The factorized decoder is the correlation-blind decoder of Pitkow et al. (2015). (c) Conclusions about the importance of correlations based on small populations do not always apply to larger populations. Consider a synthetic population with homogeneous tuning and multiplicative global fluctuations (model and parameters of Lin et al. 2015, figure 8E, with a coefficient of variation of 0.4), plus a small amount of differential correlations. For each population size (abscissa), the true information (black line) is computed from the true tuning and covariance matrix; the shuffled information (gray line) is computed after removing correlations (i.e., setting the off-diagonal entries of the covariance matrix to zero). For populations of tens of neurons, removing correlations reduces information, suggesting that correlations are helpful (brown shaded area). For larger population sizes, the true information saturates while the shuffled information grows linearly, showing correlations are harmful (purple shaded area). Thus, the conclusion that correlations increase information does not apply when considering populations that are likely to underlie function.

References

    1. Abbott LF, Dayan P. The effect of correlated variability on the accuracy of a population code. Neural Comput. 1999;11:91–101. - PubMed
    1. Adibi M, McDonald JS, Clifford CWG, Arabzadeh E. Adaptation improves neural coding efficiency despite increasing correlations in variability. J. Neurosci. 2013;33:2108–2120. - PMC - PubMed
    1. Adibi M, McDonald JS, Clifford CWG, Arabzadeh E. Population decoding in rat barrel cortex: optimizing the linear readout of correlated population responses. PLOS Comput. Biol. 2014;10(1):e1003415. - PMC - PubMed
    1. Arieli A, Sterkin A, Grinvald A, Aertsen A. Dynamics of ongoing activity: explanation of the large variability in evoked cortical responses. Science. 1996;273:1868–1871. - PubMed
    1. Atick J, Redlich A. Towards a theory of early visual processing. Neural Comput. 1990;2:308–320.

Publication types

LinkOut - more resources