. 2016 May 5:6:24658.
doi: 10.1038/srep24658.

Normal formation of a vertebrate body plan and loss of tissue maintenance in the absence of ezh2

Affiliations

Normal formation of a vertebrate body plan and loss of tissue maintenance in the absence of ezh2

Bilge San et al. Sci Rep. .

Abstract

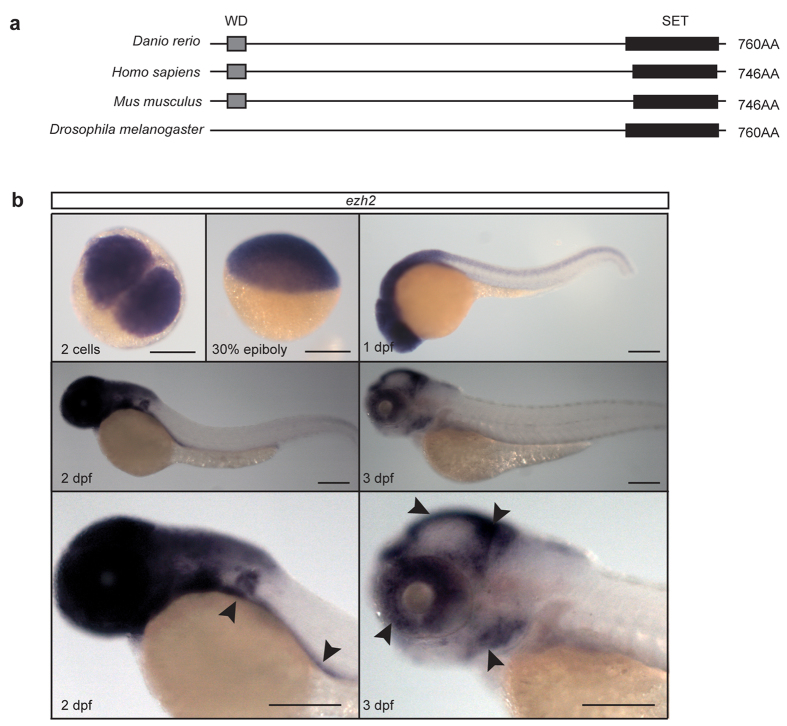
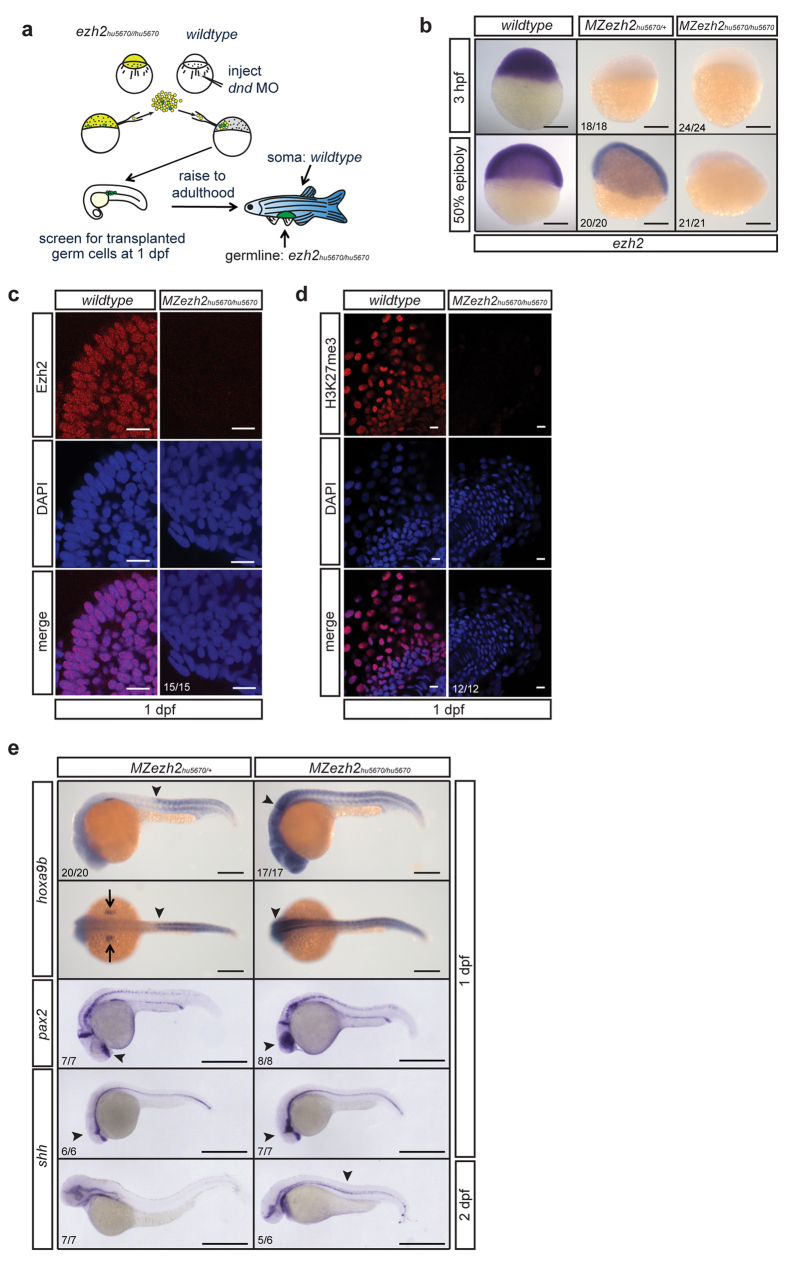
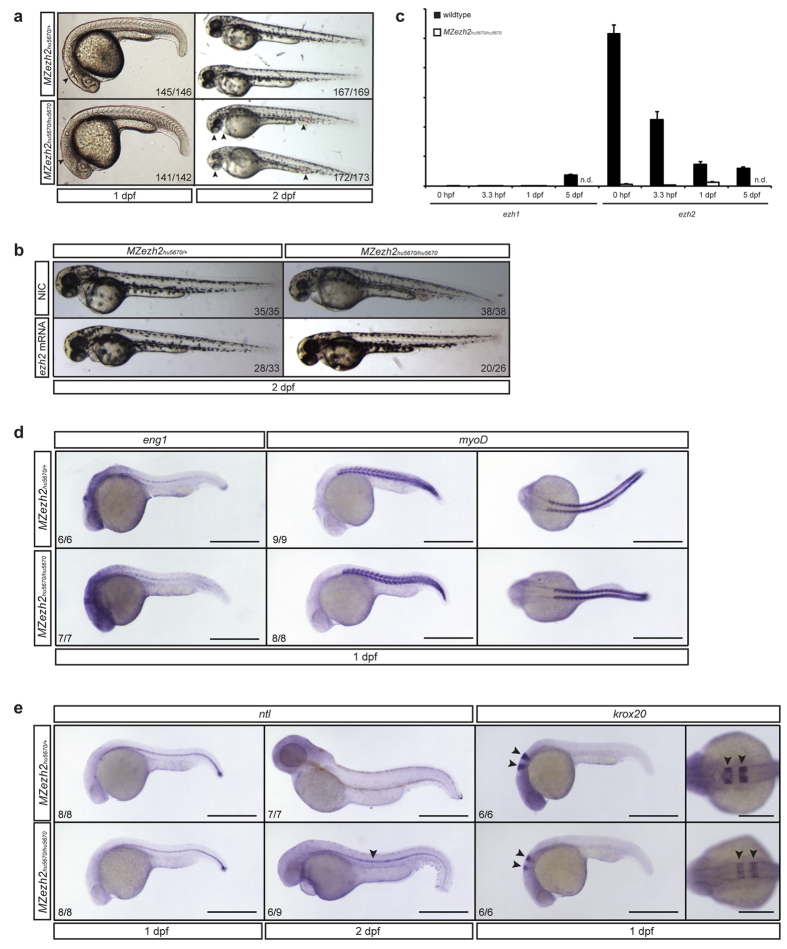
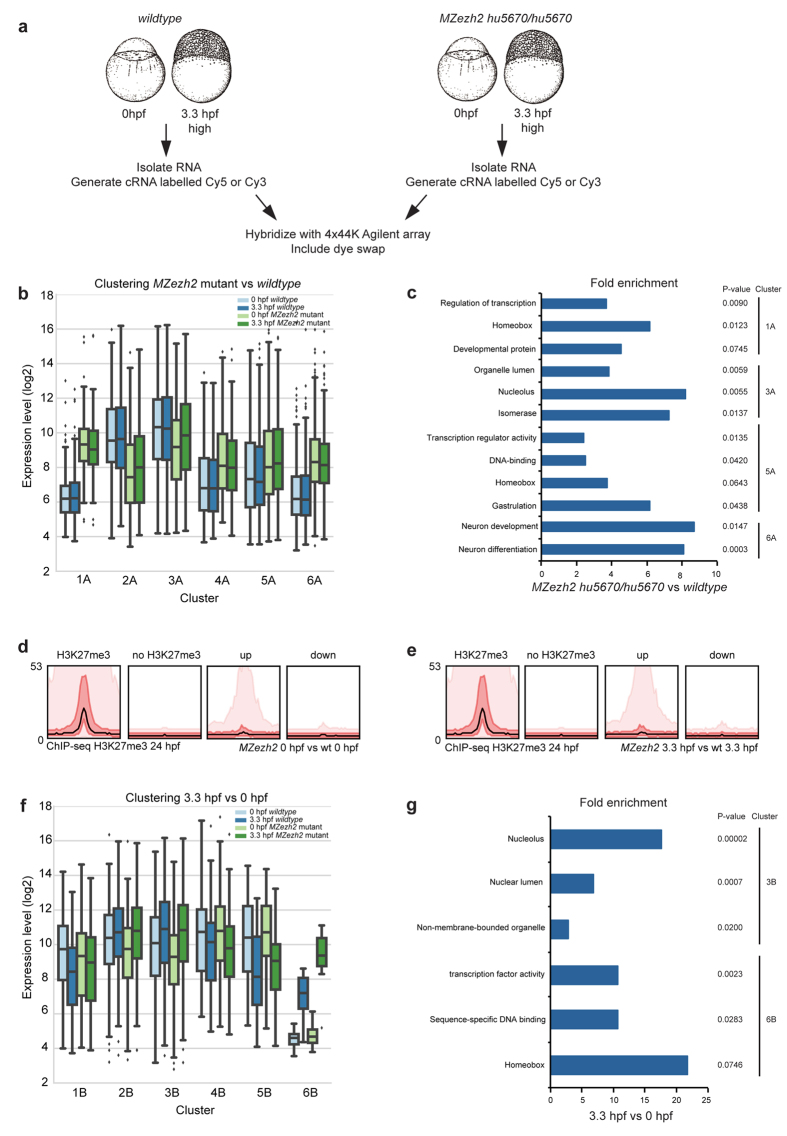
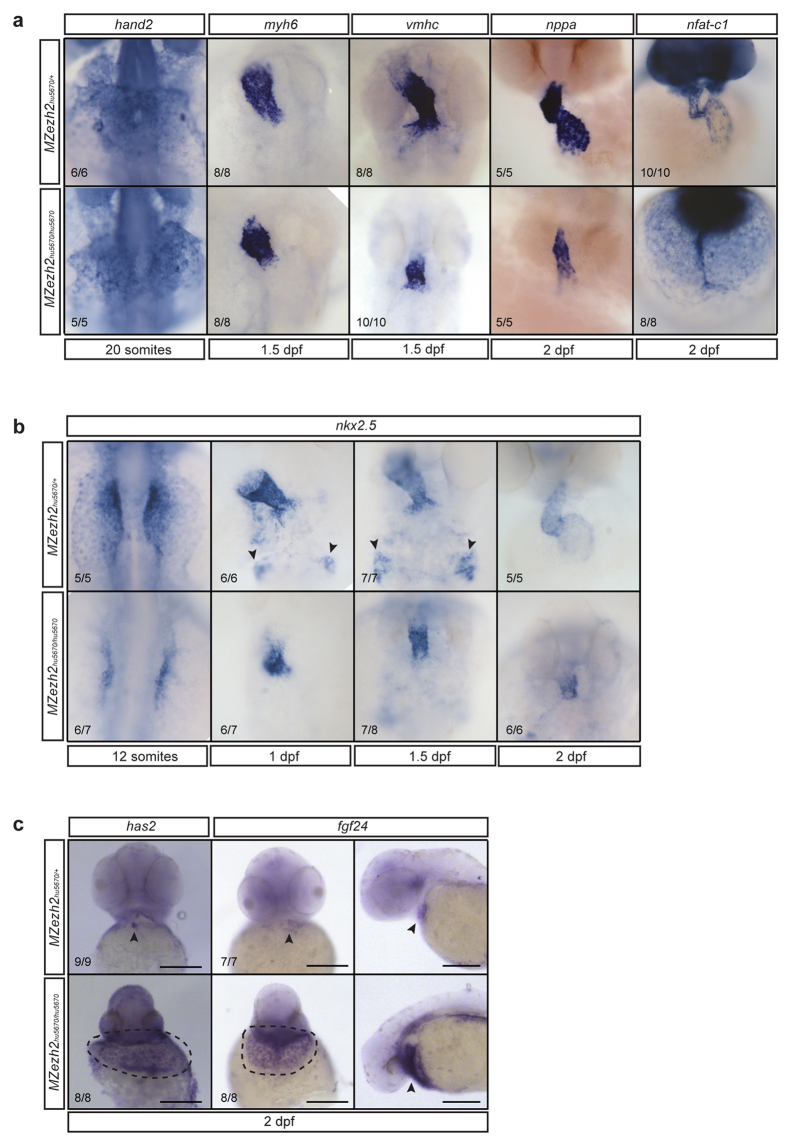
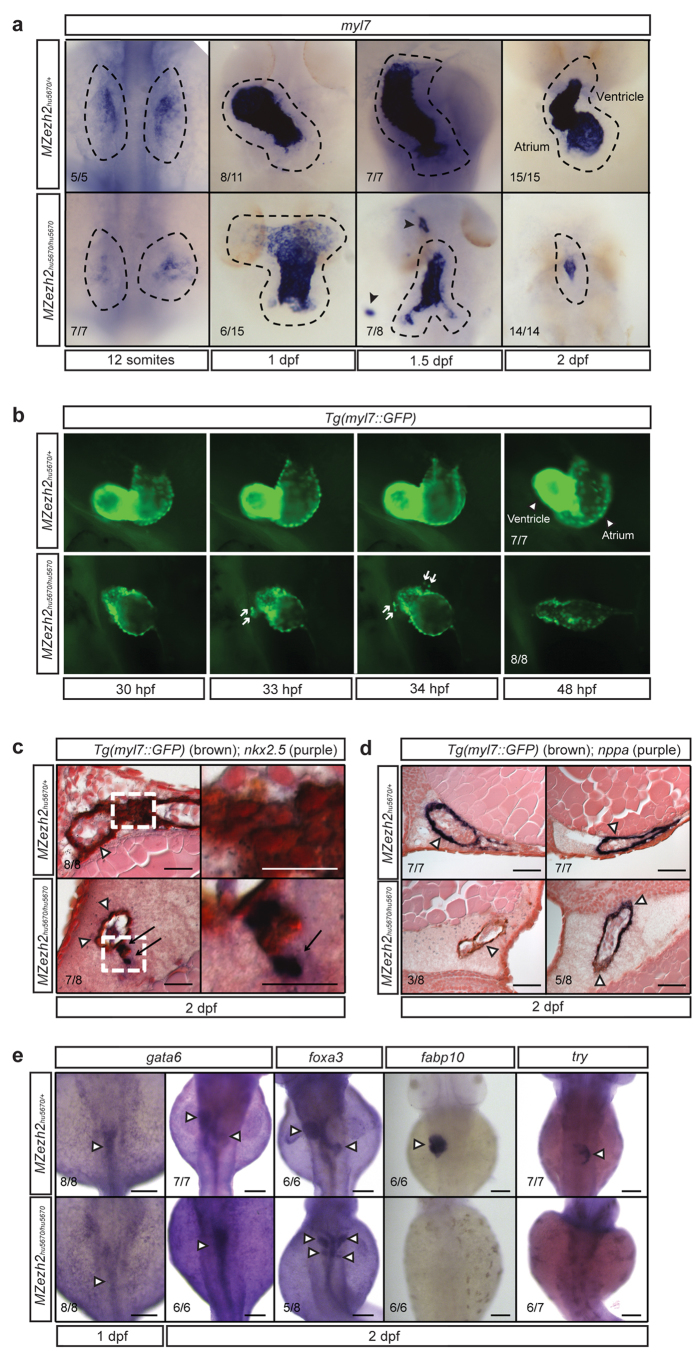
Polycomb group (PcG) proteins are transcriptional repressors of numerous genes, many of which regulate cell cycle progression or developmental processes. We used zebrafish to study Enhancer of zeste homolog 2 (Ezh2), the PcG protein responsible for placing the transcriptional repressive H3K27me3 mark. We identified a nonsense mutant of ezh2 and generated maternal zygotic (MZ) ezh2 mutant embryos. In contrast to knockout mice for PcG proteins, MZezh2 mutant embryos gastrulate seemingly normal, but die around 2 days post fertilization displaying pleiotropic phenotypes. Expression analyses indicated that genes important for early development are not turned off properly, revealing a regulatory role for Ezh2 during zygotic gene expression. In addition, we suggest that Ezh2 regulates maternal mRNA loading of zygotes. Analyses of tissues arising later in development, such as heart, liver, and pancreas, indicated that Ezh2 is required for maintenance of differentiated cell fates. Our data imply that the primary role of Ezh2 is to maintain tissues after tissue specification. Furthermore, our work indicates that Ezh2 is essential to sustain tissue integrity and to set up proper maternal mRNA contribution, and presents a novel and powerful tool to study how PcG proteins contribute to early vertebrate development.


Figures

Figure 1
Figure 1. The Polycomb group protein Ezh2 is conserved in zebrafish and ezh2 mRNA is maternally provided in zebrafish embryos.
(a) Schematic representation of Ezh2 orthologs in zebrafish, human, mouse, and Drosophila. Detailed alignments (Supplementary Fig. S1) show high conservation between the different species. This is 85% and 86% between zebrafish and human and mouse, respectively. Black boxes indicate the location of the SET domain. Grey boxes indicate the location of the WD domain. (b) In situ hybridization for ezh2 at 2 cells, 30% epiboly, 1, 2, and 3 dpf. ezh2 mRNA is maternally provided and at 2 and 3 dpf it is expressed in the pectoral fins, gut, tectum, eye, mid-hindbrain region, and the branchial arches (arrow heads). Scale bar is 200 μm.
Figure 2
Figure 2. Maternal zygotic ezh2 mutant embryos lack Ezh2 and H3K27me3, and show aberrant hox, pax, and shh gene expression.
(a) Schematic representation of germline transplantation at sphere stage to obtain germline mutant zebrafish. The progeny are maternal zygotic ezh2 mutant embryos (MZezh2hu5670/hu5670). (b) In situ hybridization for ezh2 mRNA shows maternal contribution of ezh2 as well as zygotic expression in wildtype embryos. Maternal contribution of ezh2 is lost (3 hpf) in MZezh2hu5670/+ and MZezh2hu5670/hu5670 embryos. Zygotic ezh2 expression (30% epiboly) is also lost in MZezh2hu5670/hu5670. Scale bar is 200 μm. (c) Immunostaining for Ezh2 in wildtype and MZezh2hu5670/hu5670 embryos at 1 dpf. Ezh2 shows representative nuclear localization in the forebrain of wildtype embryos and is lost in MZezh2hu5670/hu5670 embryos. Scale bar is 10 μm. (d) Immunostaining for H3K27me3 in wildtype and MZezh2hu5670/hu5670 embryos at 1 dpf. H3K27me3 shows representative nuclear localization in the tail of wildtype embryos and is lost in MZezh2hu5670/hu5670 embryos. Scale bar is 10 μm. (e) In situ hybridization for hoxa9b, pax2, and shh mRNA in MZezh2hu5670/+ and MZezh2hu5670/hu5670 embryos at 1 and 2 dpf. In MZezh2hu5670/+ embryos a clear boundary of hoxa9b expression is visible (arrow head) as well as expression in the pectoral fin buds (arrows). Expression is shifted to anterior in MZezh2hu5670/hu5670 embryos (arrow head). The expression pattern of hoxa9b in MZezh2hu5670/+ resembles that of wildtype embryos. Scale bar is 200 μm. In MZezh2hu5670/+ embryos expression of pax2 is normal and amongst others restricted to the optic stalk, mid-hindbrain boundary, and the spinal cord neurons. Expression in the optic stalk is spread throughout the eye in MZezh2hu5670/hu5670 embryos. Expression of shh is comparable to wildtype embryos in MZezh2hu5670/+ embryos at 1 and 2 dpf. In MZezh2hu5670/hu5670 embryos, expression of shh is outside the regular boundaries in the head region (arrow head) at 1 dpf and is still present at 2 dpf in the notochord, in contrast to MZezh2hu5670/+ embryos (arrow head). Scale bar is 500 μm. The numbers indicate the number of embryos with the displayed phenotype compared to the total number of embryos analyzed.
Figure 3
Figure 3. Maternal zygotic ezh2 mutants form a normal body plan and display a pleiotropic phenotype at 2 dpf.
(a) MZezh2hu5670/hu5670 appear relatively normal at 1 dpf, although a clear mid-hindbrain boundary appears to be absent (arrow head). They display a pleiotropic phenotype at 2 dpf, having small eyes, a stringy heart, and blood accumulation (arrow heads). MZezh2hu5670/+ show normal development. (b) The pleiotropic phenotypes of MZezh2hu5670/hu5670 can be rescued by injection of full-length ezh2 mRNA (300 pg). The numbers indicate the number of embryos with the displayed phenotype compared to the total number of embryos injected in two experiments. (c) Expression analysis of ezh1 and ezh2 in wildtype and MZezh2hu5670/hu5670 embryos at 0 hpf, 3.3 hpf, and 1 dpf. Expression of ezh1 is not detectable in MZezh2hu5670/hu5670 embryos and wildtype embryos at 0 hpf, 3.3 hpf, and 1 dpf. ezh1 is expressed in wildtype control embryos at 5 dpf. ezh2 is expressed in wildtype embryos at 0 hpf, 3.3 hpf, 1 dpf, and 5 dpf, showing a decrease in expression over time. ezh2 expression cannot be detected in MZezh2hu5670/hu5670 embryos. Relative expression was calculated based on expression of housekeeping genes β-actin and ef1α. Error bars represent standard deviation. n.d. is not done. (d) In situ hybridization for eng1 (muscle pioneer marker) and myoD (somite marker) at 1 dpf in MZezh2hu5670/hu5670 embryos and MZezh2hu5670/+. Both eng1 and myoD are normally expressed in MZezh2hu5670/hu5670 and MZezh2hu5670/+. Scale bar is 500 μm. (e) In situ hybridization for ntl at 1 dpf shows no difference in spatiotemporal expression between MZezh2hu5670/hu5670 embryos and the heterozygous siblings. At 2 dpf in situ hybridization for ntl showed expression in the notochord of MZezh2hu5670/hu5670 embryos, whereas this is not visible in MZezh2hu5670/+ (arrow head). In situ hybridization for krox20 at 1 dpf showed normal expression in MZezh2hu5670/+, but reduced expression in rhombomeres 3 and 5 in MZezh2hu5670/hu5670 embryos (arrow heads). Scale bar is 500 μm for lateral views and 250 μm for dorsal view of krox20 expression. The numbers indicate the number of embryos with the displayed phenotype compared to the total number of embryos analyzed.
Figure 4
Figure 4. Gene expression analysis of maternal zygotic ezh2 mutants.
(a) Schematic overview of samples that were used for microarrays and the subsequent workflow. (b) Boxplots of gene expression levels (log2) for genes in cluster 1A–6A, comparing genes that are significantly differently expressed between wildtype versus MZezh2hu5670/hu5670 embryos at 0 hpf and 3.3 hpf. In comparison, expression level (log2) of housekeeping genes actb, eef1a1, and tuba is between 7.3 and 9.3. The mean expression (log2) of the array is between 9.5 and 10.1. (c) DAVID analysis on genes differently expressed between MZezh2hu5670/hu5670 and wildtype embryos at 0 hpf and 3.3 hpf. The fold enrichment of different terms is shown for the different clusters shown in Fig. 4b (Bonferroni corrected p-value  < 0.1). (d) Bandplots of H3K27me3 ChIP-sequencing showing presence of H3K27me3 at genes that are significantly (>2-fold, p < 0.01) up- or downregulated in MZezh2hu5670/hu5670 versus wildtype embryos at 0 hpf. The graphs show transcription start site ± 20 kb. The left panel shows the intensity distribution of the H3K27me3 peaks in wildtype embryos at 24 hpf. The mean of the median is depicted as a black line, 50% is red, and 90% is pink. (e) Bandplots like in Fig. 4d for genes that are significantly up- or downregulated in MZezh2 mutant versus wildtype embryos at 3.3 hpf. (f) Boxplots of gene expression levels (log2) for genes in cluster 1B–6B (Supplementary Fig. S4), comparing genes that are significantly differently expressed between 0 hpf versus 3.3 hpf in wildtype and MZezh2hu5670/hu5670 embryos. (g) DAVID analysis on genes differently expressed between 3.3 hpf and 0 hpf in MZezh2hu5670/hu5670 and wildtype embryos. The fold enrichment of different terms is shown for the different clusters shown in Fig. 4f (Bonferroni corrected p-value < 0.1).
Figure 5
Figure 5. Myocardial development is affected in MZezh2 embryos.
(a) In situ hybridization for different heart markers in MZezh2hu5670/+ and MZezh2hu5670/hu5670 at various time points of development. hand2 is an early myocardial marker. myh6 is a marker for atrial cells. vmhc is a marker for ventricular cells. nppa is a late myocardial marker. nfat-c1 is an endocardial marker. All these markers are expressed in MZezh2hu5670/hu5670, although vmhc, nppa, and nfat-c1 expression show a smaller number of positive cells. (b) In situ hybridization for nkx2.5 at different time points after fertilization in MZezh2hu5670/+ and MZezh2hu5670/hu5670 embryos. Arrow heads point to cells of the pharyngeal arch artery progenitors. This is absent in MZezh2hu5670/hu5670. (c) In situ hybridization for has2 and fgf24 at 2 dpf in MZezh2hu5670/hu5670 and their heterozygous siblings. In MZezh2hu5670/+ expression is restricted to the heart (arrow heads), whereas in the MZezh2hu5670/hu5670 embryos expression is visible in the area surrounding the heart tube (encircled by dashed line). For fgf24 this is also shown from a lateral view (arrow heads). Scale bar is 200 μm. The numbers indicate the number of embryos with the displayed phenotype compared to the total number of embryos analyzed.
Figure 6
Figure 6. MZezh2 mutant embryos display impaired myocardial and gastrointestinal tissue maintenance.
(a) In situ hybridization for myl7 at different time points in MZezh2hu5670/+ and MZezh2hu5670/hu5670. At 1 dpf the heart of MZezh2hu5670/hu5670 is straight. In MZezh2hu5670/hu5670 embryos myl7 expressing cells are found outside the heart at 1.5 dpf (arrow heads). At 2 dpf the number of myl7 expressing cells is decreased in MZezh2hu5670/hu5670 compared to MZezh2hu5670/+. (b) Stills of time lapse (Supplementary Movie S1,2) imaging of Tg(myl7::GFP) MZezh2hu5670/+ and MZezh2hu5670/hu5670 embryos from 1 to 2 dpf. In MZezh2hu5670/hu5670 embryos, GFP-positive cells are moving away from the heart (arrows). Arrow heads point at ventricle and atrium. (c) Immunostaining for GFP to visualize Tg(myl7::GFP) (brown precipitation, arrow heads) combined with in situ hybridization for nkx2.5 (purple staining, arrows) at 2 dpf. In MZezh2hu5670/+ no nkx2.5 expressing cells are present. In MZezh2hu5670/hu5670 cells that are detached from the heart express nkx2.5. The right panel shows a zoom-in of the left panel (white square). Scale bar is 50 μm. (d) Immunostaining for GFP Tg(myl7::GFP) combined with in situ hybridization for nppa at 2 dpf in MZezh2hu5670/+ and MZezh2hu5670/hu5670 embryos. Two embryos per genotype are shown. In MZezh2hu5670/hu5670 embryos nppa expression is absent in one and not ubiquitous in the other embryo (arrow heads). In MZezh2hu5670/+ nppa is expressed in atrium and ventricle (arrow heads). Scale bar is 50 μm. (e) In situ hybridization for different gastrointestinal tract markers at 1 and 2 dpf in MZezh2hu5670/hu5670 and MZezh2hu5670/+. Expression of gata6 is present in both MZezh2hu5670/hu5670 and MZezh2hu5670/+ at 1 and 2 dpf. At 2 dpf the intestinal tube appears straight in the MZezh2hu5670/hu5670, whereas structures like the liver and pancreas can be seen in MZezh2hu5670/+ (arrow heads). MZezh2hu5670/hu5670 are able to form a gastrointestinal tract, observed by in situ hybridization for foxa3 at 2 dpf, although the organs are bilaterally formed (arrow heads). In MZezh2hu5670/hu5670 no expression of terminal differentiation markers for liver, fabp10, and exocrine pancreas, try, was observed. Scale bar is 100 μm. Numbers indicate the number of embryos with the displayed phenotype compared to the total number of embryos analyzed.

Similar articles

Cited by

References

    1. Marks P. et al. Histone deacetylases and cancer: causes and therapies. Nature reviews. Cancer 1, 194–202, doi: 10.1038/35106079 (2001). - DOI - PubMed
    1. Jones P. A. Functions of DNA methylation: islands, start sites, gene bodies and beyond. Nature reviews. Genetics 13, 484–492, doi: 10.1038/nrg3230 (2012). - DOI - PubMed
    1. Bracken A. P. & Helin K. Polycomb group proteins: navigators of lineage pathways led astray in cancer. Nature reviews. Cancer 9, 773–784, doi: 10.1038/nrc2736 (2009). - DOI - PubMed
    1. Jones R. S. & Gelbart W. M. Genetic analysis of the enhancer of zeste locus and its role in gene regulation in Drosophila melanogaster. Genetics 126, 185–199 (1990). - PMC - PubMed
    1. O’Carroll D. et al. The polycomb-group gene Ezh2 is required for early mouse development. Mol Cell Biol 21, 4330–4336 (2001). - PMC - PubMed

Publication types

MeSH terms