. 2016 May;34(5):1163-76.
doi: 10.1002/stem.2286. Epub 2016 Feb 2.

Metabolic Reprogramming and Dependencies Associated with Epithelial Cancer Stem Cells Independent of the Epithelial-Mesenchymal Transition Program

Affiliations

Metabolic Reprogramming and Dependencies Associated with Epithelial Cancer Stem Cells Independent of the Epithelial-Mesenchymal Transition Program

Esther Aguilar et al. Stem Cells. 2016 May.

Abstract

In solid tumors, cancer stem cells (CSCs) can arise independently of epithelial-mesenchymal transition (EMT). In spite of recent efforts, the metabolic reprogramming associated with CSC phenotypes uncoupled from EMT is poorly understood. Here, by using metabolomic and fluxomic approaches, we identify major metabolic profiles that differentiate metastatic prostate epithelial CSCs (e-CSCs) from non-CSCs expressing a stable EMT. We have found that the e-CSC program in our cellular model is characterized by a high plasticity in energy substrate metabolism, including an enhanced Warburg effect, a greater carbon and energy source flexibility driven by fatty acids and amino acid metabolism and an essential reliance on the proton buffering capacity conferred by glutamine metabolism. An analysis of transcriptomic data yielded a metabolic gene signature for our e-CSCs consistent with the metabolomics and fluxomics analyses that correlated with tumor progression and metastasis in prostate cancer and in 11 additional cancer types. Interestingly, an integrated metabolomics, fluxomics, and transcriptomics analysis allowed us to identify key metabolic players regulated at the post-transcriptional level, suggesting potential biomarkers and therapeutic targets to effectively forestall metastasis. Stem Cells 2016;34:1163-1176.

Keywords: Cancer stem cells; Epithelial-mesenchymal transition; Glutaminolysis; Metabolic flux analysis; Mitochondrial metabolism; Warburg effect.


Figures

Figure 1
Figure 1
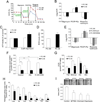
Higher glycolytic flux and dependence of PC-3M cells. (A): Comparison of PC-3M and PC-3S cells for normalized basal ECAR, (B): glucose consumption and lactate production rates and (C): LDH activity. (D): Relative contributions of glycolysis, PPP and other sources (OS) to lactate production. (E): Assessment of the Crabtree effect on OCR after exposure of cells to 18.75 mM glucose. (F): Effect of glucose deprivation (−Glc) and 5 mM 2-DG treatment (48 h) on cell proliferation. Shown are percentages of proliferation relative to cells cultured in full media and without 2-DG (Control). (G): Intracellular ATP levels analyzed after 24 h incubation with 5 mM 2-DG, normalized to DNA content. (H): Spheroid growth of PC-3M and PC-3S cells (x200). (I): Effect of 2-DG on the spheroid growth capacity of PC-3M cells (x200). (J): Glucose consumption and lactate production rates. (K): Effect of 5 mM 2-DG treatment (48 h) on cell proliferation. Percentages of proliferation relative to untreated control PC-3M, PC-3M/Snai1 or PC-3M/SKMkd cells (100% proliferation). Two-tailed Student t-test was used for statistical analyses. In panels A-E, H, significance was determined for PC-3M vs. PC-3S; F-G, I, treatment vs. control; J-K, variant cell lines vs. PC-3M. *p < 0.05, **p < 0.01 and ***p < 0.001. Abbreviations: 2-DG, 2-deoxyglucose; DCA, dichloroacetate; ECAR, extracellular acidification rate; LDH, lactate dehydrogenase; OCR, oxygen consumption rate; PPP, pentose phosphate pathway.
Figure 2
Figure 2
Enhanced mitochondrial function of PC-3S cells relative to PC-3M cells. (A): OCR profiles generated after exposure to oligomycin, FCCP + Pyr and rotenone + antimycin. (B): OCR fold change (Log2) after oligomycin, FCCP + Pyr or rotenone + antimycin injections. (C): Intracellular ATP levels analyzed after incubation (24 h) with 2 µM oligomycin. (D): Intracellular ROS levels. (E): OCR fold change (Log2) after oligomycin, FCCP + Pyr and rotenone + antimycin injections. (F): Glutamine consumption in response to disruption of glycolysis, determined after 48 h incubation (48 h) in standard media conditions (Control), without glucose or with 5 mM 2-DG. (G): Dependence of PC-3M and PC-3S cells on glucose and glutamine availability for mitochondrial respiration. Normalized basal OCR levels determined in full and restricted media conditions. (H): Ketogenic amino acids consumption rates. (I): Effect of BPTES, etomoxir and oligomycin on spheroid growth capacity of PC-3M cells (x200). Significant differences were assessed by two-tailed Student’s t-test. In panels B, D, G-H, significance was determined for PC-3M vs. PC-3S; E, variant cell lines vs. PC-3M; I, treatment vs. control. *p < 0.05, **p < 0.01 and ***p < 0.001. Abbreviations: 2-DG, 2-deoxyglucose; FCCP, trifluorocarbonylcyanide phenylhydrazone; OCR, oxygen consumption rate; Pyr, pyruvate.
Figure 3
Figure 3
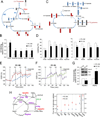
Glucose and glutamine contribute differentially to the synthesis of TCA cycle intermediates in PC-3M and PC-3S cells. (A): Labeling distribution of TCA cycle intermediates from [1,2-13C2]-glucose. In red, labeling patterns obtained from PDH; in blue, patterns corresponding to ME and PC. (B): Ratios of m2 citrate, glutamate, fumarate, malate and aspartate normalized to m2 pyruvate labeling. (C): Labeling distribution of TCA cycle intermediates from [U-13C5]-glutamine, considering oxidative metabolism (red) or reductive carboxylation (blue) of glutamine. (D): Left, m4 (m5 for glutamate) labeling of TCA cycle intermediates. Right, m3 (m5 for citrate) labeling of aspartate, malate and fumarate after incubation (24 h) with 100% [U-13C5]-glutamine. (E,F): Sequential DCA and oxamate injections (1st, 2nd, 3rd and 4th) performed at 10, 30, 50 and 70 mM oxamate, and 10, 20, 30 and 40 mM DCA. (G): Gene expression levels of PDHK1 and PDP2, determined by real-time RT-PCR. Inset: PDH and PDH phosphorylated (PDH-P) protein levels, determined by Western blotting. (H): Isodyn predictions of increased TCA cycle fluxes and mitochondrial respiration in PC-3S cells. Left, schematic representation of reactions participating in the TCA cycle. Right, estimated metabolic fluxes in PC-3M and PC-3S cells. Metabolites: α-KG, α-ketoglutarate; AcCoA, acetyl-CoA; Cit, citrate; Glu, glutamate; Fum, fumarate; Mal, malate; OAA, oxalacetate; Pyr, pyruvate. Subscripts: m, mitochondrial; c, cytosolic. Fluxes: akgfum, α-ketoglutarate to fumarate; citdmc, citrate from mitochondria to cytosol; citakg, citrate to α-ketoglutarate CS, citrate synthase; ME, malic enzyme; PC, pyruvate carboxylase; PDH, pyruvate dehydrogenase; resp, mitochondrial respiration (NADH-linked respiratory consumption rate). In panels B, D, G, significance was determined for PC-3M vs. PC-3S; E-F, oxamate vs. DCA treatments. Differences were considered significant when *p < 0.05, **p < 0.01 and ***p < 0.001 (Student’s t-test). Abbreviations: DCA, dichloroacetate; PDHK1, pyruvate dehydrogenase kinase 1; PDP2, pyruvate dehydrogenase phosphatase 2; TCA, tricarboxylic acid.
Figure 4
Figure 4
PC-3M cells are more dependent than PC-3S cells on non-anaplerotic metabolic contributions of glutaminolysis. (A): Protein levels for total GLS1 and its GAC or KGA isoforms as determined by Western blotting. (B): GAC/KGA transcript levels were determined by isoform-specific qPCR and expressed as fold change relative to PC-3M cells. (C): Sensitivity to glutaminase inhibition by BPTES. Cells were incubated with 10 µM BPTES (48 h). Shown are percentages of proliferation relative to control cells. (D): Lactate production after incubation (48 h) without (Control) or with 10 µM BPTES (E): Additive effects of BPTES and 2-DG on PC-3M cell death. after culturing cells in control media or media containing 5 mM 2-DG, 10 µM BPTES or 5mM 2-DG + 10 µM BPTES (48 h). Cell death was assessed by the annexin V-propidium iodide assay. Plots depict percentages of dead cells (apoptotic + necrotic). (F): Failure of DMK to rescue growth of BPTES-treated PC-3M or PC-3S cells. Cells were incubated (48 h) with 10 µM BPTES in the presence or absence of 2 mM DMK. (G): Levels of total intracellular glutathione. (H): Intracellular ROS levels after incubation (48 h) without (Control) and with 10 µM BPTES. (I): Intracellular glutathione levels in cells untreated or treated (48 h) with 10 µM BPTES. (J): Effect on cell proliferation of acidic media, and the combination of low pH with 10 µM BPTES (pH 7.1 + BPTES) or without bicarbonate buffering (pH 7.1 – NaHCO3) after 48 h of incubation. Percentage of proliferation relative to control conditions (pH 7.9). (K): Effect of acidic media (pH 7.0) and acidic media + 10 µM BPTES on cell proliferation. Shown are percentages of proliferation relative to standard conditions (pH 7.9). In panels B-C, G, K, significance was determined vs. PC-3M; D-F, I-J, treatment vs. control. Significant differences were assessed by Student’s t-test. *p < 0.05, **p < 0.01 and ***p < 0.001. Abbreviations: 2-DG, 2-deoxyglucose; BPTES, bis-2-(5-phenylacetamido-1,3,4-thiadiazol-2-yl)ethyl sulfide; DMK, dimethyl α-ketoglutarate; GAC, glutaminase C; GLS1, glutaminase 1; KGA, kidney-type glutaminase.
Figure 5
Figure 5
PC-3M cells are characterized by an active serine, glycine, one-carbon metabolism. (A): Serine and glycine consumption/production profiles in PC-3M and PC-3S cells after 96 h of culture. Negative values: consumption; positive values: production. (B): Extracellular serine isotopologue distribution after incubation (48 h) with 100% [U-13C6]-glucose. (C): Extracellular glycine isotopologue distribution after incubation (48 h) with 100% [U-13C6]-glucose. (D): Expression profile of genes involved in the glycine cleavage system, serine and one-carbon metabolism. Relative transcripts levels determined by qPCR represented as Log2 of ratios between PC-3M and PC-3S cells. Asterisk, genes differentially expressed at p < 0.01 and Log2 fold-change > 0.5 or < −0.5. In panels A-D, significance was determined for PC-3M vs. PC-3S. ***p < 0.001 (Student’s t-test).
Figure 6
Figure 6
Enhanced NADPH-producing fluxes and fatty acid synthetic reactions in PC-3S cells. (A): Total 13C-ribose labeling represented as Σm (m1+m2+m3+m4+m5 labeled ribose). (B): Ribose isotopologue distribution. (C): Oxidative vs. non-oxidative branches of the PPP represented as m1/m2 ribose ratio. (D): G6PDH activity. (E): TKT activity. (F): G6PDH and TKT gene expression levels determined by qRT-PCR. (G): Synthesis of palmitate and (H) stearate from glucose in PC-3S cells and PC-3M cells. Isotopologue distribution of palmitate and stearate after incubation (24 h) with 50% [1,2-13C2]-glucose. (I): ATP citrate lyase (ACLY) protein levels, assessed by Western blotting. Actin was used as a protein loading and transfer control. Two-tailed Student t-test was used for statistical analyses. In panels A-H, significance was determined for PC-3M vs. PC-3S. *p < 0.05, **p < 0.01 and ***p < 0.001. Abreviations: G6PDH, glucose-6-phosphate dehydrogenase; PPP, pentose phosphate pathway; TKT, transketolase.
Figure 7
Figure 7
A metabolic gene set differentially expressed in PC-3M vs. PC-3S cells associated with cancer progression. Left, Gene Set Enrichment Analysis of a prostate cancer expression dataset [62] showing a significant enrichment of the PC-3M metabolic gene set in metastases (M) relative to primary tumors, and in T3 and T4 stage primary tumors relative to T1 and T2 stage primary tumors. A Pearson correlation was applied to determine linear relationships between gene profiles and four phenotypes (class 1: metastatic; class 2: T4 stage primary; class 3: T3 stage primary; class 4: T1 and T2 stage primary) taken as continuous variables. Right, heatmap illustrating the relative expression levels of the 21 genes of the PC-3M metabolic gene set in 150 prostate cancer samples of the same dataset, highlighting selected genes.

References

    1. Merlo LM, Pepper JW, Reid BJ, et al. Cancer as an evolutionary and ecological process. Nat Rev Cancer. 2006;6:924–935. - PubMed
    1. Hanahan D, Weinberg RA. Hallmarks of cancer: the next generation. Cell. 2011;144:646–674. - PubMed
    1. Chaffer CL, Brueckmann I, Scheel C, et al. Normal and neoplastic nonstem cells can spontaneously convert to a stem-like state. Proc Natl Acad Sci U S A. 2011;108:7950–7955. - PMC - PubMed
    1. Mani SA, Guo W, Liao MJ, et al. The epithelial-mesenchymal transition generates cells with properties of stem cells. Cell. 2008;133:704–715. - PMC - PubMed
    1. Papagerakis S, Pannone G, Zheng L, et al. Oral epithelial stem cells - implications in normal development and cancer metastasis. Exp Cell Res. 2014;325:111–129. - PMC - PubMed

Publication types

MeSH terms