

HUWE1 interacts with PCNA to alleviate replication stress
- PMID: 27146073
- PMCID: PMC5278616
- DOI: 10.15252/embr.201541685
HUWE1 interacts with PCNA to alleviate replication stress
Abstract
Defects in DNA replication, DNA damage response, and DNA repair compromise genomic stability and promote cancer development. In particular, unrepaired DNA lesions can arrest the progression of the DNA replication machinery during S-phase, causing replication stress, mutations, and DNA breaks. HUWE1 is a HECT-type ubiquitin ligase that targets proteins involved in cell fate, survival, and differentiation. Here, we report that HUWE1 is essential for genomic stability, by promoting replication of damaged DNA We show that HUWE1-knockout cells are unable to mitigate replication stress, resulting in replication defects and DNA breakage. Importantly, we find that this novel role of HUWE1 requires its interaction with the replication factor PCNA, a master regulator of replication fork restart, at stalled replication forks. Finally, we provide evidence that HUWE1 mono-ubiquitinates H2AX to promote signaling at stalled forks. Altogether, our work identifies HUWE1 as a novel regulator of the replication stress response.
Keywords: DNA replication; H2AX; HUWE1; PCNA; genomic instability.
© 2016 The Authors.
Figures
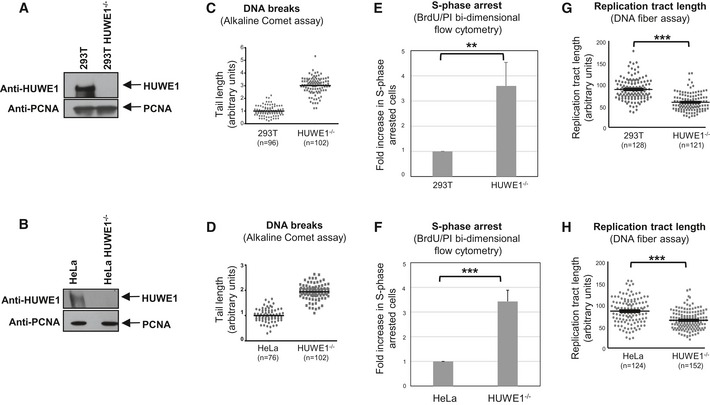
- A, B
Western blot showing the absence of HUWE1 protein in 293T (A) and HeLa (B) cells subjected to CRISPR/Cas9‐mediated HUWE1 deletion.
- C, D
HUWE1‐knockout 293T (C) and HeLa (D) cells show increased DNA breaks in the absence of exogenous DNA damage treatment. Results from the alkaline comet assay are shown. The “n” numbers of comet tails analyzed (pooled from two independent experiments), as well as the mean, are indicated on the graphs. HUWE1‐knockout HeLa cells did not show increased breakage in the neutral comet assay (Fig EV1B), indicating that the majority of breaks observed in cycling HUWE1‐knockout cells are not double‐strand breaks, but rather single‐strand breaks and other types of lesions.
- E, F
Increased S‐phase arrest in HUWE1‐knockout 293T (E) and HeLa (F) cells. Cycling cells were incubated with BrdU and subjected to BrdU/PI bi‐dimensional flow cytometry. Representative flow cytometry profiles are presented in Fig EV1D–F. Bars represent the fold increase in the percentage of cells with S‐phase DNA content (between 2N and 4N) but negative for BrdU staining. Bars represent the average of three independent experiments, with error bars showing SD. The P‐values are 0.0091 (E) and 0.0007 (F).
- G, H
The DNA fiber assay shows reduced replication tract length in HUWE1‐knockout 293T (G) and HeLa (H) cells in the absence of exogenous DNA damage treatment. The “n” numbers of fibers analyzed (pooled from three independent experiments), as well as the mean ± SEM, are indicated on the graphs. P‐values are 9.8 × 10⁻²² (G) and 1.0 × 10⁻¹⁰ (H).
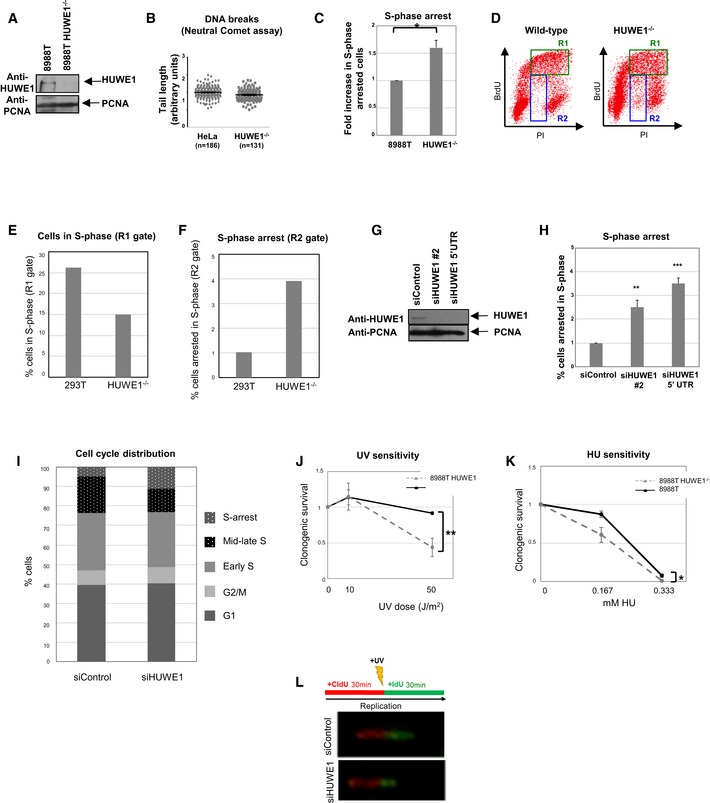
- A
Western blot showing the absence of HUWE1 protein in 8988T cells subjected to CRISPR/Cas9‐mediated HUWE1 deletion.
- B
HUWE1‐knockout HeLa cells show no increase in Neutral Comet tail length. Cells were analyzed under normal growth conditions (no DNA damage treatment). The “n” numbers of comet tails analyzed (pooled from three independent experiments), as well as the mean ± SEM, are indicated on the graphs. We would like to mention that both normal and HUWE1‐knockout cells showed no real “tails” but rather very short “smears”, likely indicating that no DNA breaks are occurring in any of these cells. We measured those tails anyway, and present the result in this figure, in an attempt to provide a quantification of this result.
- C
Increased S‐phase arrest in HUWE1‐knockout 8988T cells, as measured using the BrdU/PI bi‐dimensional flow cytometry assay. The average of three experiments, with standard deviations, is shown. P‐value is 0.011 (calculated using the t‐test two‐tailed, equal variance).
- D
Representative BrdU/PI bi‐dimensional flow cytometry profiles of wild‐type and HUWE1‐knockout 293T cells. Cells in mid‐ and late S‐phase (DNA content >2 N and positive for BrdU) are labeled as R1 region. Cells with S‐phase DNA content (between 2N and 4N) but negative for BrdU staining represent S‐phase‐arrested cells and are indicated as R2 region.
- E, F
Quantifications of R1 and R2 regions from the plot shown in (D), showing the proportions of cells in each region. While only one representative plot is shown, this result was reproduced in three independent experiments.
- G
Western blot showing that the siRNA oligonucleotides used are efficiently knocking down HUWE1 levels in 293T cells.
- H
Increased S‐phase arrest in 293T cells following HUWE1 knockdown. The percentage of cells arrested in S‐phase is shown. The average of five experiments, with standard deviations, is presented. The P‐values shown (calculated using the t‐test two‐tailed, equal variance) indicate the statistical significance relative to siControl (0.0024 and 0.0001, respectively).
- I
Quantification of cell cycle distribution of control and HUWE1‐depleted 293T cells, showing the altered distribution of mid‐late S‐phase vs. S‐phase‐arrested cells. Shown are G1 (BrdU‐negative, 2N DNA content); G2/M (BrdU‐negative, 4N DNA content); early S (BrdU‐positive, 2N DNA content); mid‐late S (BrdU‐positive, >2N DNA content); S‐arrest (BrdU‐negative, DNA content between 2N and 4N). The quantification of one representative plot is shown, but this result was reproduced in many independent experiments.
- J, K
UV (J) and HU (K) sensitivity of HUWE1‐knockout 8988T cells. The average of three experiments, with standard deviations, is shown. P‐values (calculated using the t‐test two‐tailed, equal variance) are 0.0029 (J) and 0.0126 (K).
- L
Schematic of the experimental setup, including examples of micrographs, for the DNA fiber experiment.
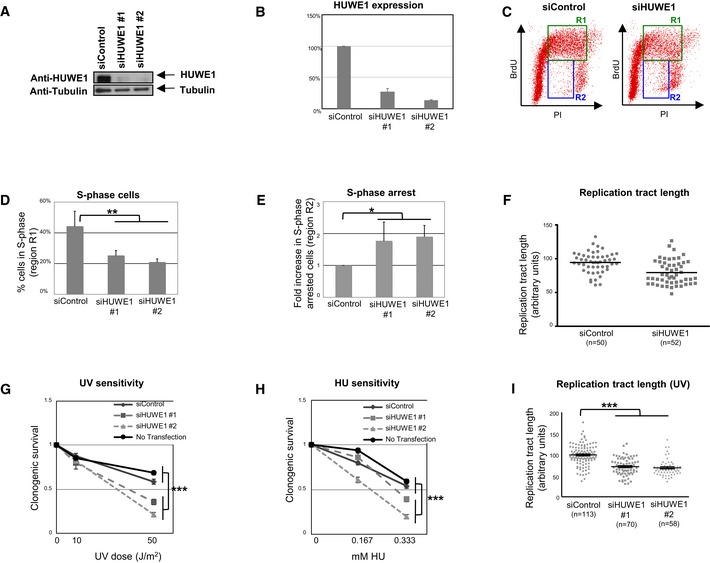
- A
HUWE1 levels are efficiently downregulated by two different HUWE1 siRNA oligonucleotides in 8988T cells.
- B
Quantification of HUWE1 expression following siRNA treatment. Band intensity was quantified using ImageJ software and normalized to tubulin loading control. The average of three experiments is shown. Error bars indicate SD.
- C–E
Cell cycle analyses by flow cytometry using BrdU/PI double staining show increased replication arrest in HUWE1‐depleted 8988T cells in the absence of exogenous DNA damage treatment. (C) Representative flow cytometry profiles of control and HUWE1‐knockdown cells. R1‐labeled region indicates mid‐ and late S‐phase cells (BrdU‐positive, > 2N DNA content), while R2‐labeled region indicates S‐phase arrested cells (BrdU‐negative, DNA content between 2N and 4N). (D) Quantification of S‐phase cells. Percentage of cells in R1 region is shown. Bars represent the average of three independent experiments. Error bars indicate SD. P‐value is 0.0014. (E) Quantification of S‐phase arrested cells. Bars represent the fold increase in the percentage of cells in R2 region, normalized to siControl‐treated cells. The average of three independent experiments is shown. Error bars indicate SD. P‐value is 0.0135.
- F
DNA fiber experiment showing reduced replication tract length in HUWE1‐depleted HeLa cells in the absence of exogenous DNA damage treatment. The “n” numbers of fibers analyzed (pooled from two independent experiments), as well as the mean, are indicated on the graphs.
- G, H
Clonogenic assay showing that HUWE1 knockdown in 8988T cells are sensitive to UV (G) and HU (H). As controls, both cells transfected with non‐targeting siRNA (siControl) and non‐transfected cells were used. Note that the siHUWE1#2 oligonucleotide shows a stronger downregulation of HUWE1 and confers increased sensitivity compared to siHUWE1#1. The average of nine experiments is shown. Error bars represent SEM. P‐values (representing the statistical difference between the samples at the highest dose treatment) are 4.55 × 10⁻⁹ (G) and 1.8 × 10⁻⁸ (H).
- I
DNA fiber experiments showing decreased replication tract length following UV‐B treatment (30 J/m2) in HUWE1‐depleted HeLa cells. The “n” numbers of fibers analyzed (pooled from three independent experiments), as well as the mean ± SEM, are indicated on the graphs. P‐value is 2.11 × 10⁻²⁰.
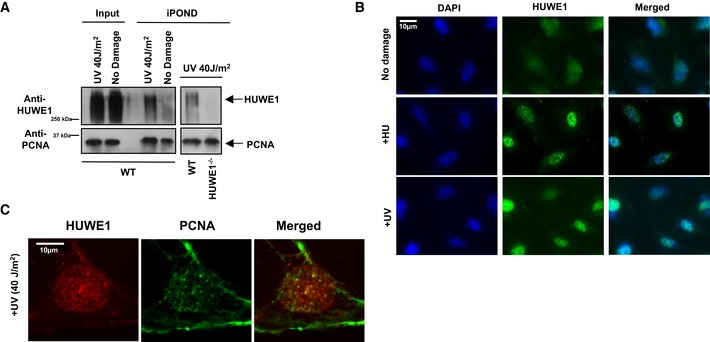
iPOND experiment showing that HUWE1 localizes to replication forks in 293T cells. Binding to nascent DNA was increased after UV exposure. Because of the difficulties in removing all the cross‐links in high molecular weight proteins, HUWE1 is detected as a high molecular weight smear. A control experiment using the HUWE1‐knockout cells (shown in the right side panel) confirmed the specificity of the HUWE1 signal.
Immunofluorescence experiment showing that HUWE1 localizes to chromatin foci in HeLa cells exposed to replication fork stalling agents HU (2 mM for 16 h) and UV (40 J/m2, analyzed 2 h later).
Co‐immunofluorescence experiments showing co‐localization of HUWE1 and PCNA in chromatin foci. U2OS cells were analyzed 2 h after exposure to UV (40 J/m2). Quantifications of co‐localization, and additional micrographs are presented in Fig EV2A–D.
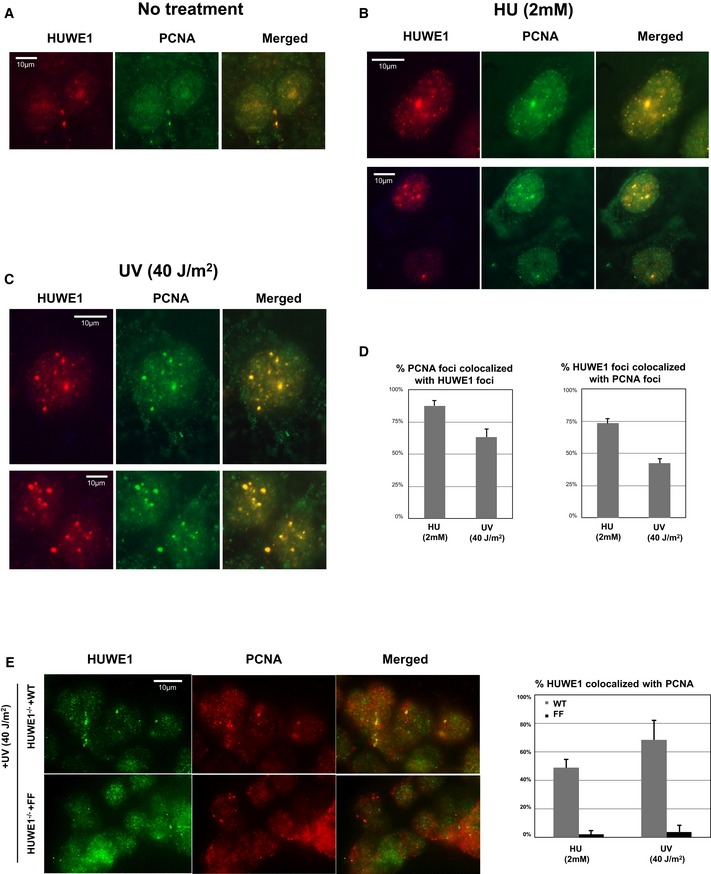
- A–C
Representative immunofluorescence micrographs of U2OS cells untreated (A), treated with 2 mM HU for 24 h (B), or exposed to 40 J/m2 UV and analyzed 2 h later (C).
- D
Quantifications showing the percentage of PCNA foci co‐localizing with HUWE1 foci and, reciprocally, the percentage of HUWE1 foci co‐localizing with PCNA foci. Only cells with more than five foci were analyzed. The average of three experiments, with standard errors, is shown. In total, 191 HUWE1 and 156 PCNA foci were counted.
- E
HUWE1‐knockout cells corrected with wild‐type or PIP mutant were subjected to immunofluorescence using HUWE1 and PCNA antibodies. Similar to the endogenous protein, Myc‐HUWE1 wild‐type forms UV‐ and HU‐induced chromatin foci. In contrast, the PIP‐box mutant does not co‐localize with PCNA after damage exposure. Shown are representative micrographs, as well as quantifications of the percentage of PCNA foci co‐localizing with HUWE1 and, reciprocally, the percentage of HUWE1 foci co‐localizing with PCNA, in wild‐type and PIP mutant‐corrected cells. Only cells with more than five foci were analyzed. The average of three experiments, with standard errors, is shown. A total number of foci counted were as follows: for the HU experiment: 162 HUWE1‐WT foci with 144 PCNA foci; 196 HUWE1‐FF foci with 163 PCNA foci. For the UV experiment: 146 HUWE1‐WT foci with 121 PCNA foci; 101 HUWE1‐FF foci with 78 PCNA foci.
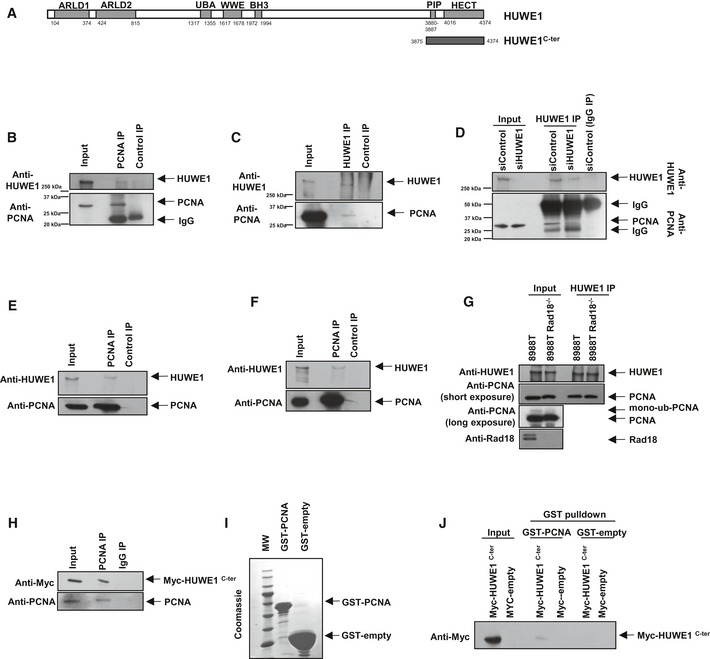
- A
Schematic representation of full‐length HUWE1. Shown is the PIP‐box domain we describe here (aa 3880‐3887). ARLD: Armadillo repeat‐like domain; UBA: ubiquitin‐associated domain; BH3: Bcl2‐homology three domain; HECT: homologous to the E6‐AP carboxyl terminus (catalytic ubiquitin ligase domain). The span of the HUWE1C‐ter (3875‐end) fragment used in subsequent studies is also indicated.
- B–D
Interaction between endogenous HUWE1 and PCNA in 293T cells. (B) Anti‐PCNA immunoprecipitation, showing that HUWE1 co‐precipitates. (C) Reciprocal experiment showing that PCNA co‐precipitates with HUWE1 in anti‐HUWE1 immunoprecipitation. (D) As control, endogenous HUWE1 was depleted by siRNA treatment, and extracts were subjected to anti‐HUWE1 immunoprecipitation. The HUWE1 blot shows that much less HUWE1 is precipitated by anti‐HUWE1 antibodies from HUWE1‐knockdown cells than control, as expected. PCNA is co‐precipitated by anti‐HUWE1 antibodies from control, but not HUWE1‐depleted cells, showing that the interaction is specific and not due to unspecific binding of PCNA to anti‐HUWE1 antibodies.
- E, F
HUWE1 co‐precipitates with PCNA in anti‐PCNA immunoprecipitation from extracts of MCF7 (E) and 8988T (F) cells, showing that the HUWE1–PCNA interaction can be detected in different cell lines.
- G
Co‐immunoprecipitation experiment from control and Rad18‐knockout 293T cells, showing that the HUWE1–PCNA interaction is not affected by loss of PCNA ubiquitination. Rad18‐knockout cells were obtained by CRISPR/Cas9 technology. The Rad18 and PCNA blots show loss of Rad18 and of PCNA ubiquitination, respectively.
- H
Myc‐HUWE1C‐ter fragment was transfected in 293T cells. Anti‐PCNA immunoprecipitation shows that the C‐terminal HUWE1 fragment interacts with PCNA.
- I
Coomassie staining of recombinant GST‐PCNA expressed and purified from bacteria.
- J
GST‐pull downs using GST‐PCNA or GST‐empty as control, and extracts of 293T cells transfected with Myc‐HUWE1C‐ter, showing interaction of this fragment with recombinant PCNA.
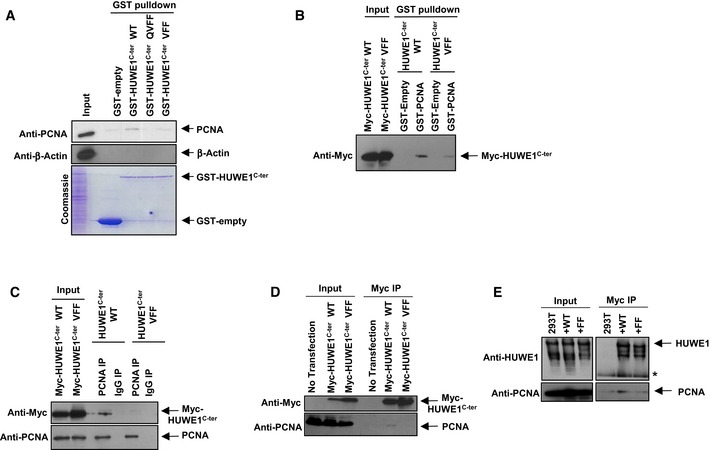
- A, B
GST‐pull downs showing that HUWE1 PIP‐box mutants do not interact with PCNA. (A) Recombinant GST‐tagged HUWE1C‐ter, either wild‐type or PIP‐box mutant variants (QVFF and VFF—the indicated residues, critical for the PIP‐box, were mutated to A), were purified from bacteria (see Coomassie staining) and employed for GST‐pull downs using extracts of 293T cells. PCNA co‐precipitated with wild‐type but not PIP‐box mutants. (B) Reciprocal GST‐pull down using recombinant GST‐PCNA and extracts of 293T cells overexpressing Myc‐HUWE1C‐ter. Wild‐type but not the PIP‐box mutant (VFF) HUWE1 fragment bound to GST‐PCNA.
- C, D
Reciprocal co‐immunoprecipitation experiments showing that PIP‐box mutation abolishes PCNA interaction. (C) 293T cells were transfected with Myc‐HUWE1C‐ter variants and subjected to anti‐PCNA (C) or anti‐Myc (D) immunoprecipitation. Only wild‐type but not PIP‐box mutant (VFF) HUWE1 interacted with PCNA in both experimental setups.
- E
Mutation of the PIP‐box in full‐length HUWE1 also blocks PCNA interaction. Full‐length Myc‐tagged HUWE1 (wild‐type or PIP mutant) was transfected in 293T cells. Following Myc‐immunoprecipitation, endogenous PCNA was detected in wild‐type but not PIP‐box mutant (FF) complexes.
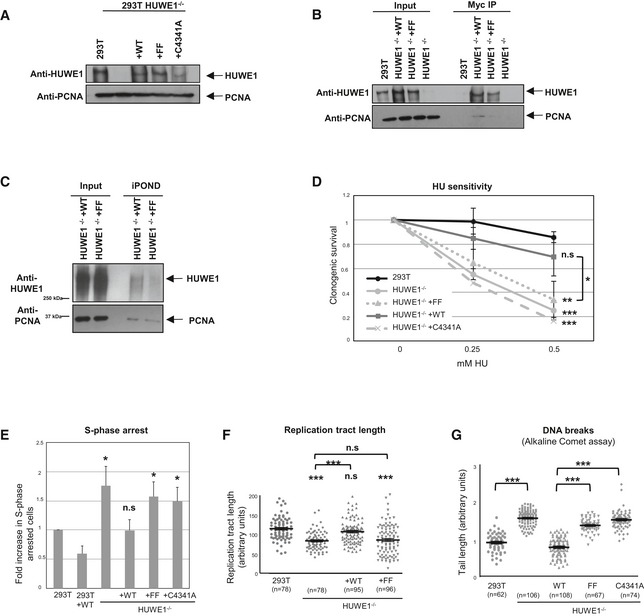
Stable expression of Myc‐tagged wild‐type, PIP‐box mutant, and catalytically inactive HUWE1 variants in HUWE1‐knockout 293T cells. The Western blot shows that expression of the Myc‐tagged variants stably transfected in the knockout cell lines is similar to the endogenous HUWE1 expression.
Myc‐tag immunoprecipitation using extracts of the corrected cell lines described above. As expected, PCNA co‐precipitates with wild‐type but not PIP‐box mutant HUWE1 (FF).
iPOND experiment using HUWE1‐knockout 293T cells, corrected with wild‐type or PIP mutant HUWE1. The PIP mutant shows reduced cross‐linking to nascent DNA, indicating defective recruitment to replication forks.
Clonogenic assay showing that stable expression of wild‐type HUWE1, but not of the PIP‐box mutant or the catalytic mutant, corrects the HU sensitivity of the HUWE1‐knockout 293T cells. Shown is the average of three independent experiments ± SD. If not indicated otherwise, the P‐values shown specify the statistical significance relative to 293T (for the 0.5 mM HU condition). P‐values are as follows: 0.0003 (293T vs. HUWE1−/−); 0.157 (293T vs. HUWE1−/− +WT); 0.0045 (293T vs. HUWE1−/− +FF); 0.0006 (293T vs. HUWE1−/− +C4341A); 0.047 (HUWE1−/− +WT vs. HUWE1−/− +FF).
The S‐phase arrest phenotype is also rescued by wild‐type but not PIP mutant or catalytic mutant HUWE1. S‐phase arrested cells were quantified using the BrdU/PI bi‐dimensional flow cytometry assay. Shown is the average of three independent experiments ± SD. The P‐values shown specify the statistical significance relative to 293T (0.018, 0.957, 0.015, and 0.024, respectively). A quantification of the same data, showing the percentage of cells arrested in S‐phase, is shown in Fig EV3A.
Normal replication tract length, quantified using the DNA fiber assay, is restored by expressing wild‐type, but not PIP mutant HUWE1, in the HUWE1‐knockout 293T cells. The “n” numbers of fibers analyzed (pooled from three independent experiments), as well as the mean ± SEM, are indicated on the graphs. If not indicated otherwise, the P‐values shown specify the statistical significance relative to 293T. P‐values are 1.47 × 10⁻¹¹ (293T vs. HUWE−/− samples), 0.094 (293T vs. HUWE−/− +WT samples), 1.40 × 10⁻⁷ (293T vs. HUWE−/− +FF samples), 1.22 × 10⁻⁷ (HUWE−/− vs. HUWE−/− +WT samples), and 0.679 (HUWE−/− vs. HUWE−/− +FF samples).
Alkaline comet assay showing that wild‐type but not the FF mutant can correct the breakage phenotype of HUWE1‐knockout 293T cells. The “n” numbers of comet tails analyzed (pooled from three independent experiments), as well as the mean ± SEM, are indicated on the graphs. The P‐values indicated are 4.18 × 10−43 (293T vs. HUWE−/− samples), 6.89 × 10−41 (HUWE1−/− +WT vs. FF samples), and 5.97 × 10−50 (HUWE1−/− +WT vs. C4341A samples).
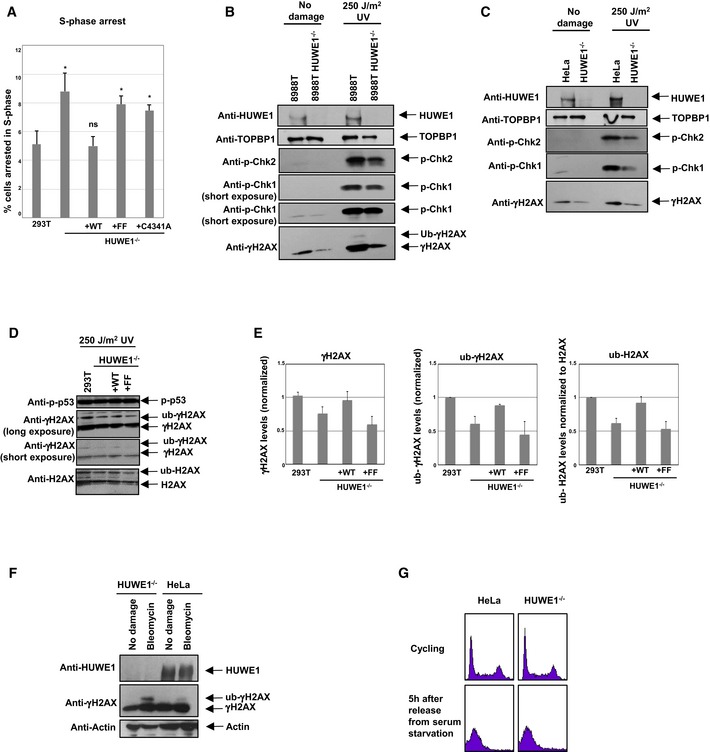
- A
Correction of the S‐phase arrest phenotype by wild‐type but not PIP mutant HUWE1. The same data as in Fig 6E are shown, but this time the percent of cells in S‐phase is plotted. Shown is the average of three independent experiments ± SD. The P‐values shown (calculated using the t‐test two‐tailed, equal variance), indicate the statistical significance relative to 293T (0.015, 0.865, 0.011, and 0.016, respectively).
- B, C
Western blots showing reduced γH2AX and phospho‐Chk1 in HUWE1‐knockout 8988T (B) and HeLa (C) cells.
- D
Western blots showing reduced H2AX modification in HUWE1‐knockout 293T cells, corrected by wild‐type but not PIP mutant HUWE1.
- E
Quantification of γH2AX (against input control), γH2AX ubiquitination (against un‐ubiquitinated γH2AX), and H2AX ubiquitination (against unmodified H2AX). The average of three experiments is shown. Error bars represent standard deviations.
- F
HUWE1 deletion does not reduce H2AX ubiquitination in G1. HeLa cells (wild‐type or HUWE1‐knockout) were arrested in G0 by serum starvation for 24 h, than released in normal media. Cells were analyzed 5 h later, when they reached G1. Cells were either treated with 5 μM bleomycin for the last 2 h of the release or left untreated.
- G
Flow cytometry profile (PI staining) of cells at the harvest time point (5 h after release from serum starvation). The plot indicates that cells are uniformly in G1. For comparison, the normal profile of cycling cells is also presented.
- A, B
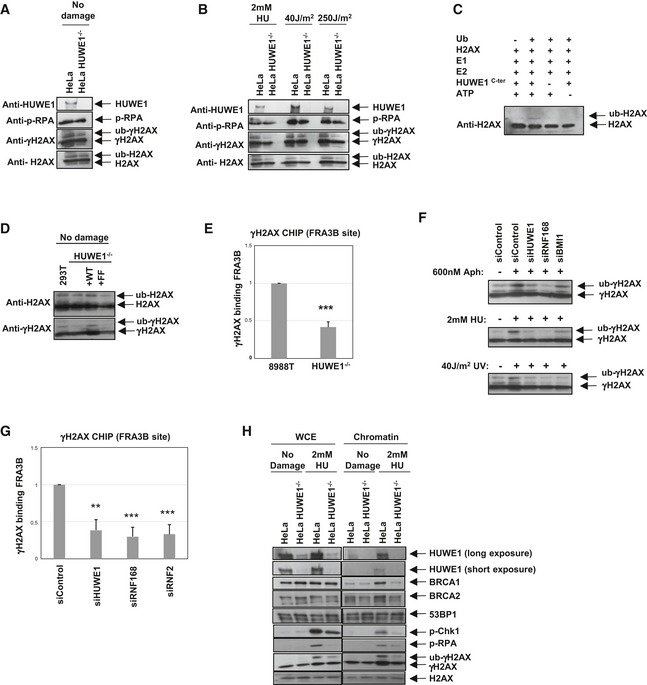
The impact of HUWE1 on H2AX phosphorylation and ubiquitination, under normal conditions (A) or upon induction of replication stress (2 mM HU for 18 h, or 2 h after exposure to 40 J/m2 UV). Control or HUWE1‐knockout HeLa cells were analyzed.
- C
In vitro ubiquitination assay showing that recombinant HUWE1C‐ter can mono‐ubiquitinate H2AX.
- D
Wild‐type but not the PIP mutant can correct the defective H2AX ubiquitination in HUWE1‐knockout 293T cells.
- E
Chromatin immunoprecipitation showing that γH2AX binding to the common fragile site FRA3B is reduced in HUWE1‐knockout 8988T cells. Cells were treated with 600 nM aphidicolin for 24 h. Binding was quantified relative to input material. Shown is the average of four experiments ± SD. P‐value is 4.4 × 10⁻⁶.
- F
Western blots showing that several H2AX ubiquitin ligases participate in γH2AX ubiquitination following replication stress. HUWE1, RNF168, and BMI1 were knocked‐down in HeLa cells. The efficiency of the knockdown is shown in Fig EV4. Cells were treated with 600 nM aphidicolin for 24 h, 2 mM HU for 24 h, or analyzed 2 h after exposure to 40 J/m2 UV.
- G
Chromatin immunoprecipitation from HeLa cells, showing that knockdown of H2AX ubiquitin ligases can reduce γH2AX binding to FRA3B. Cells were treated with 600 nM aphidicolin for 24 h. Binding was quantified relative to input material. Shown is the average of three experiments ± SD. The P‐values shown indicate the statistical significance relative to siControl (0.0016, 0.0005, and 0.0009, respectively).
- H
Chromatin fractionation experiments showing that HUWE1‐knockout HeLa cells, treated with 2 mM HU for 24 h, fail to efficiently recruit BRCA1 and BRCA2 proteins to DNA. In contrast, 53BP1 chromatin association is not induced by HU treatment, and not affected by HUWE1 knockout, and thus can serve as loading control. Shown are blots of whole‐cell extract (WCE) samples, representing input material, and of chromatin pellet samples.
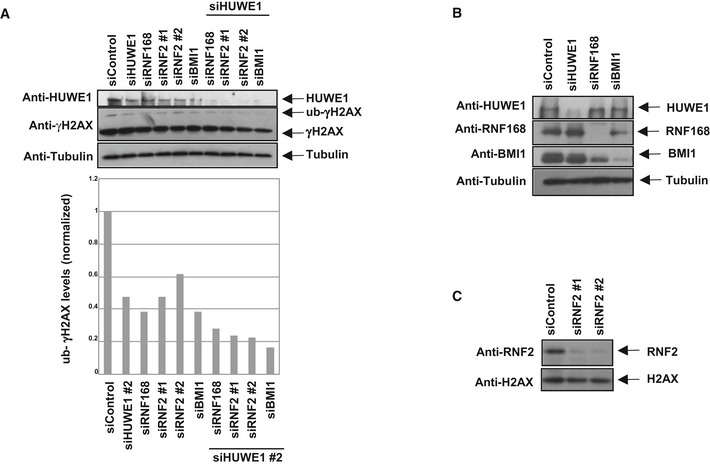
- A
Representative Western blot experiment in HeLa cells. A quantification of this experiment is also shown. This result was replicated in three independent experiments.
- B, C
Western blots showing the efficient depletion of H2AX ubiquitin ligases.
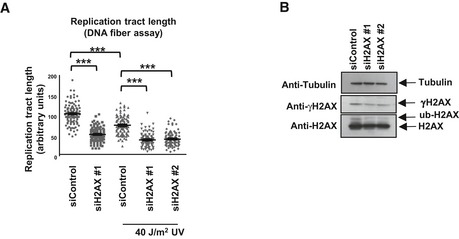
DNA fiber assay using HeLa cells with H2AX knockdown. Cells were either treated with 40 J/m2 UV (analyzed 2 h later) or left untreated. The “n” numbers of samples are 101, 101, 106, 92, and 100, respectively (pooled from three independent experiments). P‐values (calculated using the t‐test two‐tailed, equal variance) are 1.19 × 10−40 (siControl vs. siH2AX, no damage samples); 5.6 × 10⁻¹⁵ (siControl, no damage vs. UV samples); 1.1 × 10⁻²⁰ (siControl vs. siH2AX #1, UV samples); 9.01 × 10⁻³² (siControl vs. siH2AX #2, UV samples).
Western blot of HeLa cells showing the impact of H2AX siRNA oligonucleotides.
Comment in
-
HUWE1 comes to the rescue at stalled replication forks.EMBO Rep. 2016 Jun;17(6):781-2. doi: 10.15252/embr.201642551. Epub 2016 May 4. EMBO Rep. 2016. PMID: 27146074 Free PMC article.
Similar articles
-
Nuclear insulin-like growth factor 1 receptor phosphorylates proliferating cell nuclear antigen and rescues stalled replication forks after DNA damage.J Biol Chem. 2017 Nov 3;292(44):18227-18239. doi: 10.1074/jbc.M117.781492. Epub 2017 Sep 18. J Biol Chem. 2017. PMID: 28924044 Free PMC article.
-
PCNA-mediated stabilization of E3 ligase RFWD3 at the replication fork is essential for DNA replication.Proc Natl Acad Sci U S A. 2018 Dec 26;115(52):13282-13287. doi: 10.1073/pnas.1814521115. Epub 2018 Dec 10. Proc Natl Acad Sci U S A. 2018. PMID: 30530694 Free PMC article.
-
Characterization of human Spartan/C1orf124, an ubiquitin-PCNA interacting regulator of DNA damage tolerance.Nucleic Acids Res. 2012 Nov;40(21):10795-808. doi: 10.1093/nar/gks850. Epub 2012 Sep 16. Nucleic Acids Res. 2012. PMID: 22987070 Free PMC article.
-
Ubiquitylation at the Fork: Making and Breaking Chains to Complete DNA Replication.Int J Mol Sci. 2018 Sep 25;19(10):2909. doi: 10.3390/ijms19102909. Int J Mol Sci. 2018. PMID: 30257459 Free PMC article. Review.
-
Regulation of DNA damage tolerance in mammalian cells by post-translational modifications of PCNA.Mutat Res. 2017 Oct;803-805:82-88. doi: 10.1016/j.mrfmmm.2017.06.004. Epub 2017 Jun 21. Mutat Res. 2017. PMID: 28666590 Review.
Cited by
-
Genomic Instability and Replicative Stress in Multiple Myeloma: The Final Curtain?Cancers (Basel). 2021 Dec 22;14(1):25. doi: 10.3390/cancers14010025. Cancers (Basel). 2021. PMID: 35008191 Free PMC article. Review.
-
The HECT domain ubiquitin ligase HUWE1 targets unassembled soluble proteins for degradation.Cell Discov. 2016 Nov 8;2:16040. doi: 10.1038/celldisc.2016.40. eCollection 2016. Cell Discov. 2016. PMID: 27867533 Free PMC article.
-
BRPF3-HUWE1-mediated regulation of MYST2 is required for differentiation and cell-cycle progression in embryonic stem cells.Cell Death Differ. 2020 Dec;27(12):3273-3288. doi: 10.1038/s41418-020-0577-1. Epub 2020 Jun 18. Cell Death Differ. 2020. PMID: 32555450 Free PMC article.
-
Forging Ahead through Darkness: PCNA, Still the Principal Conductor at the Replication Fork.Mol Cell. 2017 Feb 2;65(3):380-392. doi: 10.1016/j.molcel.2016.12.020. Mol Cell. 2017. PMID: 28157503 Free PMC article. Review.
-
Direct regulation of Chk1 protein stability by E3 ubiquitin ligase HUWE1.FEBS J. 2020 May;287(10):1985-1999. doi: 10.1111/febs.15132. Epub 2019 Nov 29. FEBS J. 2020. PMID: 31713291 Free PMC article.
References
-
- Gaillard H, Garcia‐Muse T, Aguilera A (2015) Replication stress and cancer. Nat Rev Cancer 15: 276–289 - PubMed
-
- Moldovan GL, Pfander B, Jentsch S (2007) PCNA, the maestro of the replication fork. Cell 129: 665–679 - PubMed
-
- Maga G, Hubscher U (2003) Proliferating cell nuclear antigen (PCNA): a dancer with many partners. J Cell Sci 116: 3051–3060 - PubMed
MeSH terms
Substances
Grants and funding
LinkOut - more resources
Full Text Sources
Other Literature Sources
Research Materials
Miscellaneous
