

Loss of CENP-F results in distinct microtubule-related defects without chromosomal abnormalities
- PMID: 27146114
- PMCID: PMC4927273
- DOI: 10.1091/mbc.E15-12-0848
Loss of CENP-F results in distinct microtubule-related defects without chromosomal abnormalities
Abstract
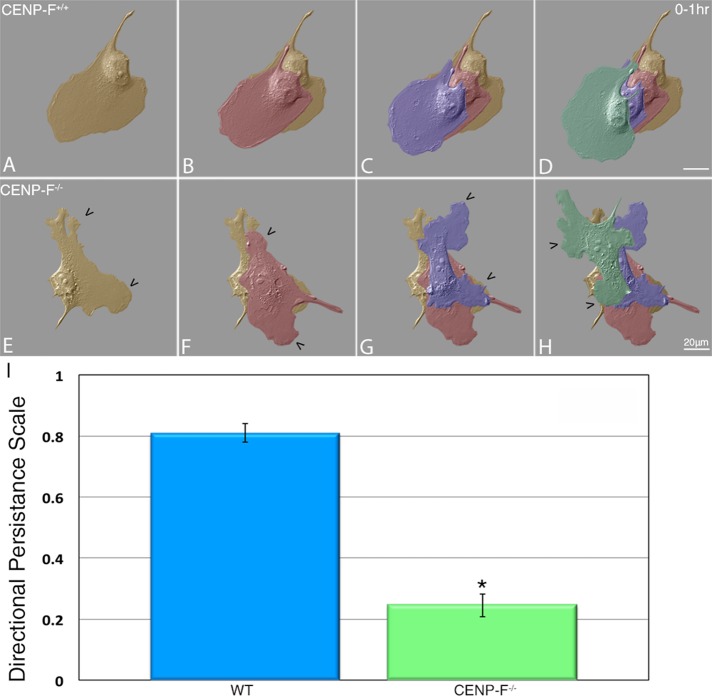
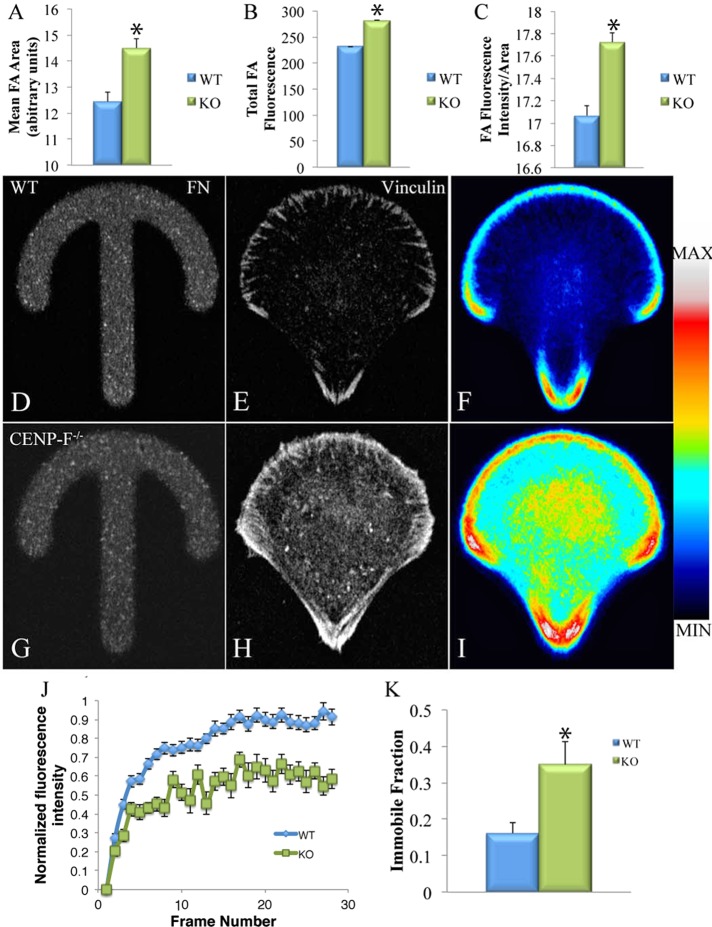
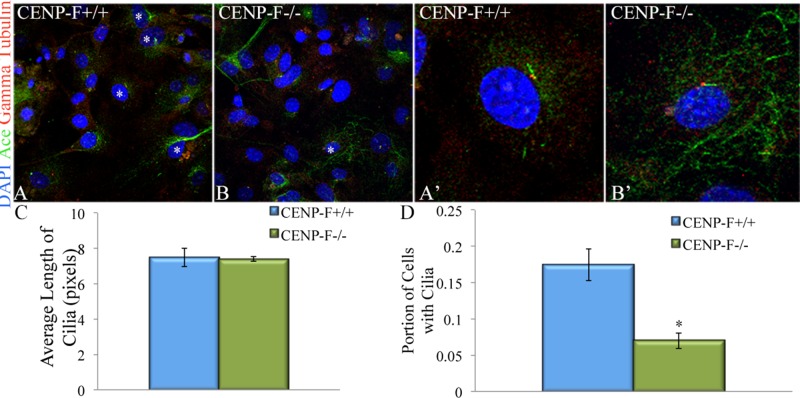
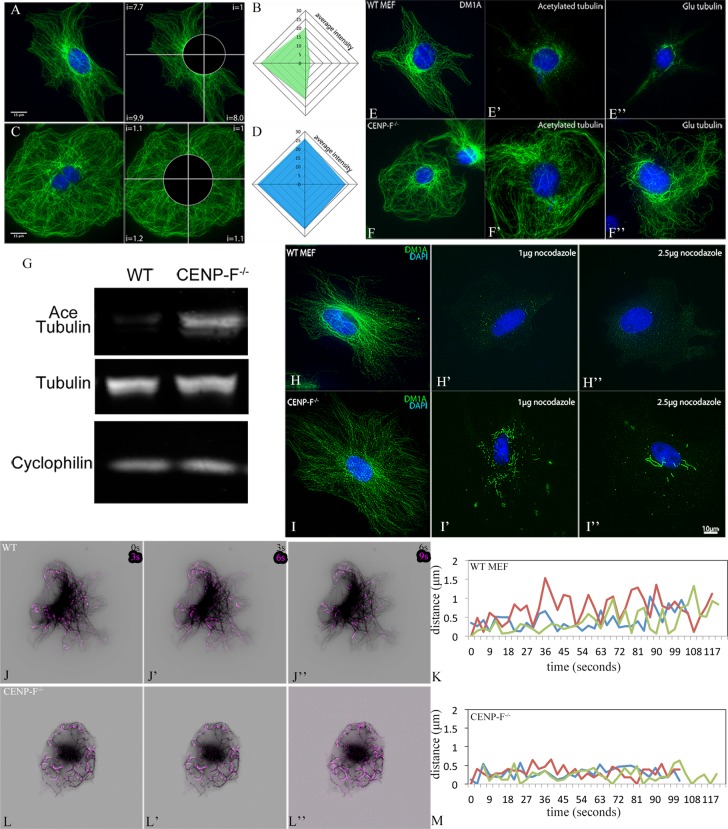
Microtubule (MT)-binding centromere protein F (CENP-F) was previously shown to play a role exclusively in chromosome segregation during cellular division. Many cell models of CENP-F depletion show a lag in the cell cycle and aneuploidy. Here, using our novel genetic deletion model, we show that CENP-F also regulates a broader range of cellular functions outside of cell division. We characterized CENP-F(+/+) and CENP-F(-/-) mouse embryonic fibroblasts (MEFs) and found drastic differences in multiple cellular functions during interphase, including cell migration, focal adhesion dynamics, and primary cilia formation. We discovered that CENP-F(-/-) MEFs have severely diminished MT dynamics, which underlies the phenotypes we describe. These data, combined with recent biochemical research demonstrating the strong binding of CENP-F to the MT network, support the conclusion that CENP-F is a powerful regulator of MT dynamics during interphase and affects heterogeneous cell functions.
© 2016 Pfaltzgraff et al. This article is distributed by The American Society for Cell Biology under license from the author(s). Two months after publication it is available to the public under an Attribution–Noncommercial–Share Alike 3.0 Unported Creative Commons License (http://creativecommons.org/licenses/by-nc-sa/3.0).
Figures
Similar articles
-
Small GTPase Rab5 participates in chromosome congression and regulates localization of the centromere-associated protein CENP-F to kinetochores.Proc Natl Acad Sci U S A. 2011 Oct 18;108(42):17337-42. doi: 10.1073/pnas.1103516108. Epub 2011 Oct 10. Proc Natl Acad Sci U S A. 2011. PMID: 21987812 Free PMC article.
-
Centromere protein F includes two sites that couple efficiently to depolymerizing microtubules.J Cell Biol. 2015 Jun 22;209(6):813-28. doi: 10.1083/jcb.201408083. J Cell Biol. 2015. PMID: 26101217 Free PMC article.
-
Unstable microtubule capture at kinetochores depleted of the centromere-associated protein CENP-F.EMBO J. 2005 Nov 16;24(22):3927-39. doi: 10.1038/sj.emboj.7600848. Epub 2005 Oct 27. EMBO J. 2005. PMID: 16252009 Free PMC article.
-
Cenp-F (mitosin) is more than a mitotic marker.Chromosoma. 2006 Aug;115(4):288-95. doi: 10.1007/s00412-005-0046-0. Epub 2006 Mar 25. Chromosoma. 2006. PMID: 16565862 Review.
-
The unconventional kinetoplastid kinetochore: from discovery toward functional understanding.Biochem Soc Trans. 2016 Oct 15;44(5):1201-1217. doi: 10.1042/BST20160112. Biochem Soc Trans. 2016. PMID: 27911702 Free PMC article. Review.
Cited by
-
Calcium depletion destabilises kinetochore fibres by the removal of CENP-F from the kinetochore.Sci Rep. 2017 Aug 4;7(1):7335. doi: 10.1038/s41598-017-07777-6. Sci Rep. 2017. PMID: 28779172 Free PMC article.
-
Loss of CENPF leads to developmental failure in mouse embryos.Cell Cycle. 2019 Oct;18(20):2784-2799. doi: 10.1080/15384101.2019.1661173. Epub 2019 Sep 3. Cell Cycle. 2019. PMID: 31478449 Free PMC article.
-
Regulation of Cenp-F localization to nuclear pores and kinetochores.Cell Cycle. 2018;17(17):2122-2133. doi: 10.1080/15384101.2018.1520569. Epub 2018 Sep 20. Cell Cycle. 2018. PMID: 30198378 Free PMC article.
-
Disentangling the molecular determinants for Cenp-F localization to nuclear pores and kinetochores.EMBO Rep. 2018 May;19(5):e44742. doi: 10.15252/embr.201744742. Epub 2018 Apr 9. EMBO Rep. 2018. PMID: 29632243 Free PMC article.
-
Loss of CENP-F Results in Dilated Cardiomyopathy with Severe Disruption of Cardiac Myocyte Architecture.Sci Rep. 2018 May 15;8(1):7546. doi: 10.1038/s41598-018-25774-1. Sci Rep. 2018. PMID: 29765066 Free PMC article.
References
-
- Ashe M, Pabon-Pena L, Dees E, Price KL, Bader D. LEK1 is a potential inhibitor of pocket protein-mediated cellular processes. J Biol Chem. 2004;279:664–676. - PubMed
-
- Aytes A, Mitrofanova A, Lefebvre C, Alvarez MJ, Castillo-Martin M, Zheng T, Eastham JA, Gopalan A, Pienta KJ, Shen MM, et al. Cross-species regulatory network analysis identifies a synergistic interaction between FOXM1 and CENPF that drives prostate cancer malignancy. Cancer Cell. 2014;25:638–651. - PMC - PubMed
Publication types
MeSH terms
Substances
Grants and funding
LinkOut - more resources
Full Text Sources
Other Literature Sources
Research Materials
