

Why RBE must be a variable and not a constant in proton therapy
- PMID: 27146168
- PMCID: PMC5257325
- DOI: 10.1259/bjr.20160116
Why RBE must be a variable and not a constant in proton therapy
Abstract
Objective: This article considered why the proton therapy (PT) relative biological effect (RBE) should be a variable rather than a constant.
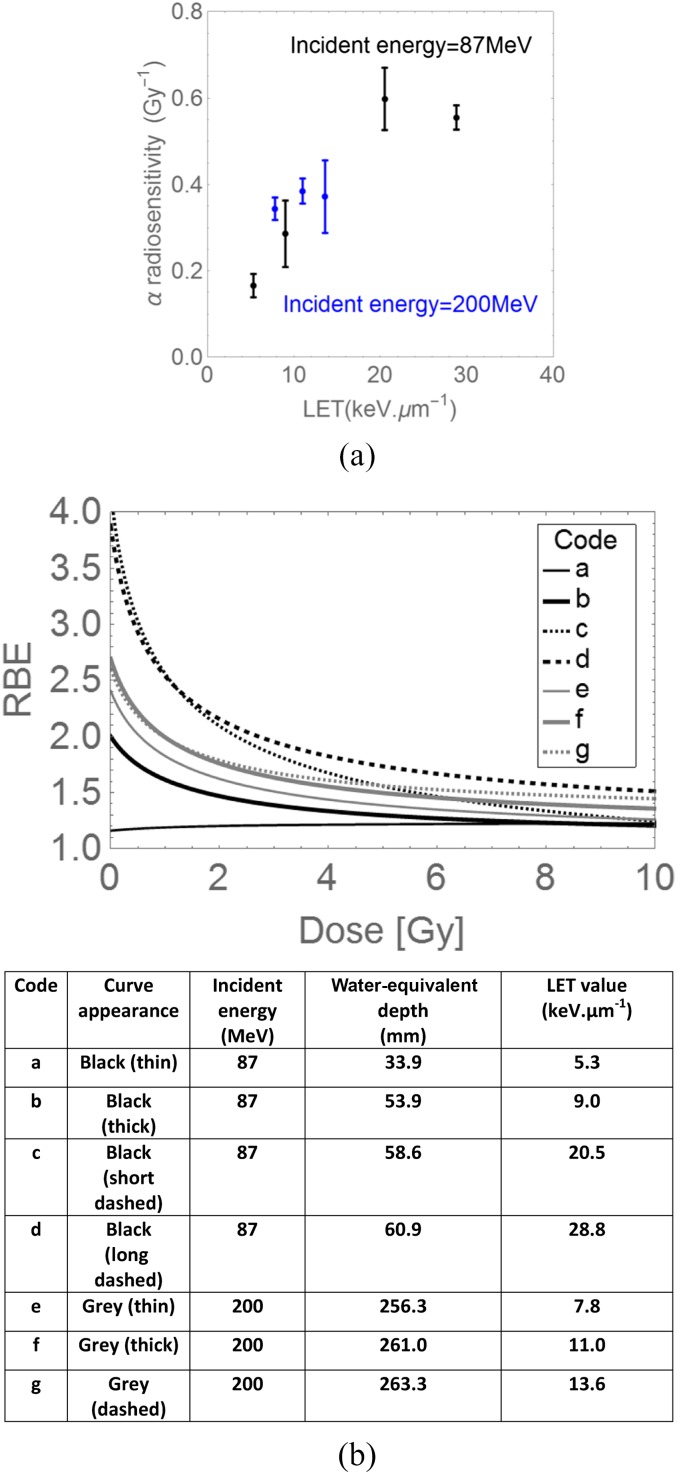
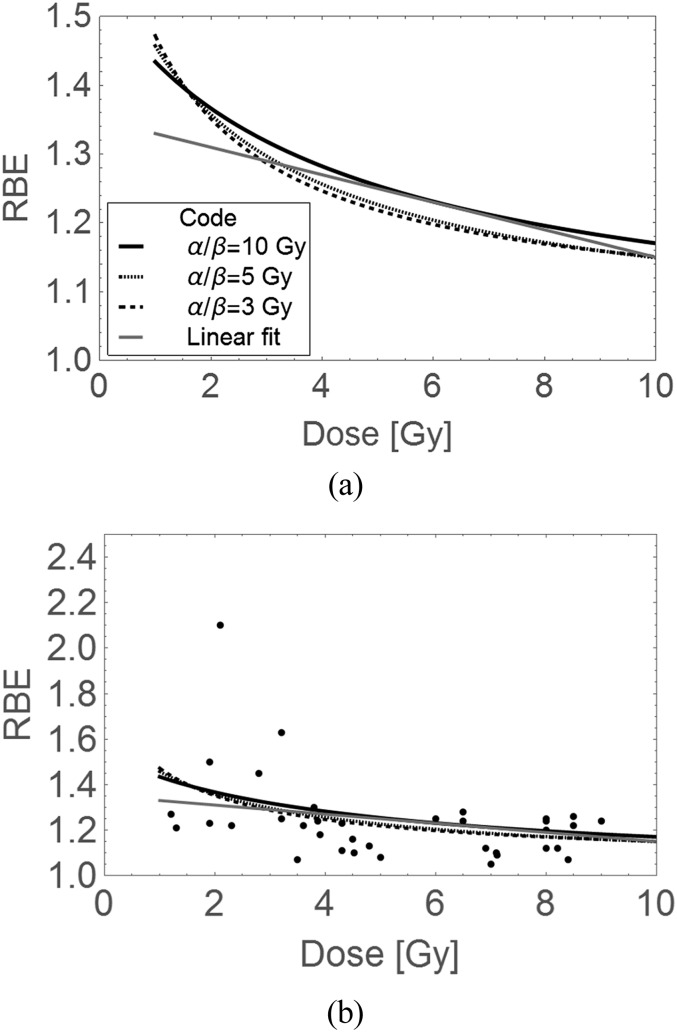
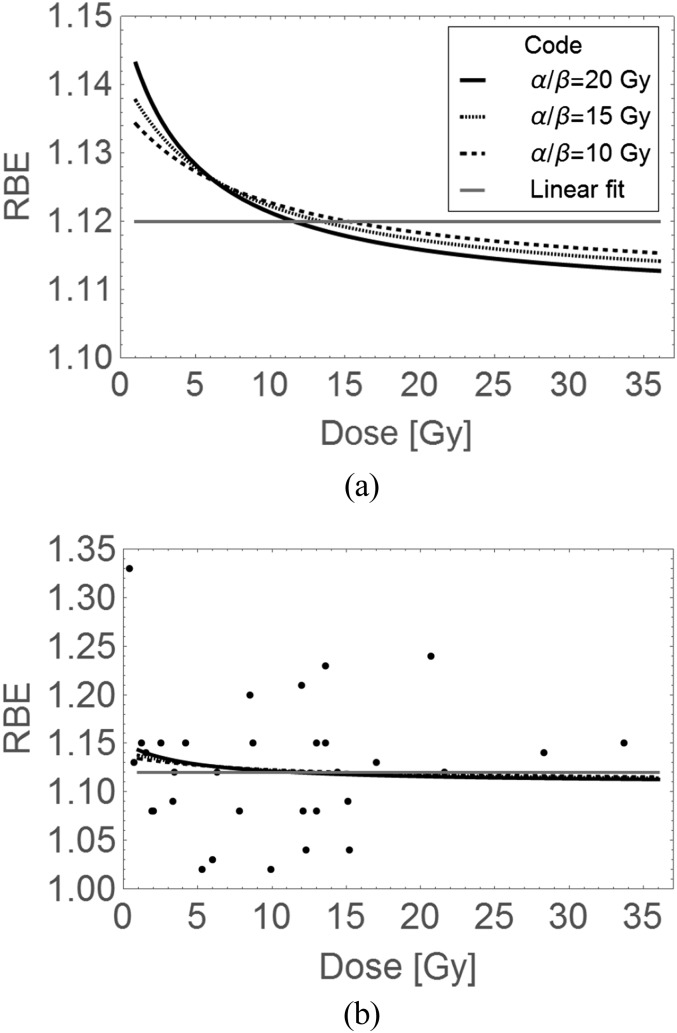
Methods: The reasons for a variable proton RBE are enumerated, with qualitative and quantitative arguments. The heterogeneous data sets collated by Paganetti et al (2002) and the more homogeneous data of Britten et al (2013) are further analyzed using linear regression fitting and RBE-inclusive adaptations of the linear-quadratic (LQ) radiation model.
Results: The in vitro data show RBE increasing as dose per fraction is lowered. In the Paganetti et al (2002) data sets, the differences between observed and expected effects are smaller when the LQ model is used, but with such data heterogeneity, firm statistical conclusions cannot be obtained. The more homogeneous data set shows an unequivocal variation in RBE with dose per faction. The in vivo data are inappropriate for assessments of late normal tissue effects in radiotherapy. Also, if there is the same degree of uncertainty in an RBE of 1.1 or in an RBE of 2-3 for C ions, the fractional and biological effective doses can vary considerably and be greater in the proton case. So, errors in RBE assignment are important for protons, just as with C ions.
Conclusion: Further experimental programmes are proposed, including late normal tissue end points. Better RBE allocations might further improve PT outcomes.
Advances in knowledge: This study provides a rigorous critique of the 1.1 RBE used for protons, from theoretical and practical standpoints. Data analysis shows that the LQ model is more appropriate than simple linear regression. Comprehensive research programmes are suggested.
Figures
Comment in
-
Commentary: RBE in proton therapy - where is the experimental in vivo data?Acta Oncol. 2019 Oct;58(10):1337-1339. doi: 10.1080/0284186X.2019.1669819. Epub 2019 Oct 3. Acta Oncol. 2019. PMID: 31578911 No abstract available.
References
-
- International Commission on Radiation Units and Measurements. Prescribing, recording, and reporting proton-beam therapy. (ICRU Report 78). Bethesda, USA: NIH; 2010.
-
- Jones B, Dale RG. Estimation of optimum dose per fraction for high LET radiations: implications for proton radiotherapy, Int J Radiat Oncol Biol Phys 2000; 48: 1549–57. - PubMed
MeSH terms
LinkOut - more resources
Full Text Sources
Other Literature Sources
