

Trajectory of body shape in early and middle life and all cause and cause specific mortality: results from two prospective US cohort studies
- PMID: 27146280
- PMCID: PMC4856853
- DOI: 10.1136/bmj.i2195
Trajectory of body shape in early and middle life and all cause and cause specific mortality: results from two prospective US cohort studies
Abstract
Objective: To assess body shape trajectories in early and middle life in relation to risk of mortality.
Design: Prospective cohort study.
Setting: Nurses' Health Study and Health Professionals Follow-up Study.
Population: 80 266 women and 36 622 men who recalled their body shape at ages 5, 10, 20, 30, and 40 years and provided body mass index at age 50, followed from age 60 over a median of 15-16 years for death.
Main outcome measures: All cause and cause specific mortality.
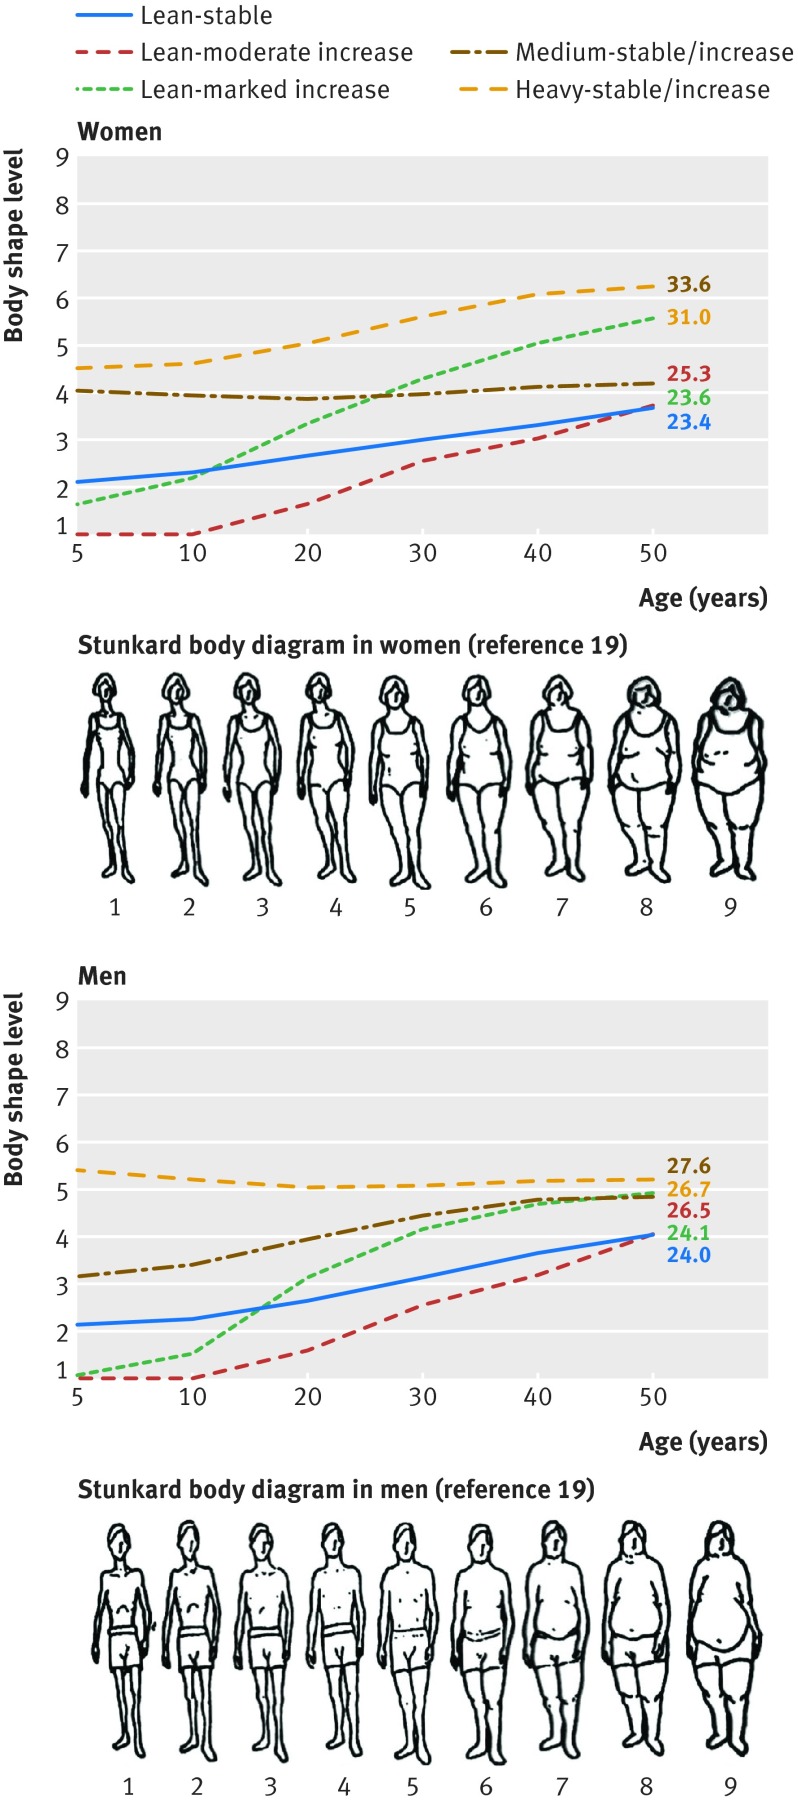
Results: Using a group based modeling approach, five distinct trajectories of body shape from age 5 to 50 were identified: lean-stable, lean-moderate increase, lean-marked increase, medium-stable/increase, and heavy-stable/increase. The lean-stable group was used as the reference. Among never smokers, the multivariable adjusted hazard ratio for death from any cause was 1.08 (95% confidence interval 1.02 to 1.14) for women and 0.95 (0.88 to 1.03) for men in the lean-moderate increase group, 1.43 (1.33 to 1.54) for women and 1.11 (1.02 to 1.20) for men in the lean-marked increase group, 1.04 (0.97 to 1.12) for women and 1.01 (0.94 to 1.09) for men in the medium-stable/increase group, and 1.64 (1.49 to 1.81) for women and 1.19 (1.08 to 1.32) for men in the heavy-stable/increase group. For cause specific mortality, participants in the heavy-stable/increase group had the highest risk, with a hazard ratio among never smokers of 2.30 (1.88 to 2.81) in women and 1.45 (1.23 to 1.72) in men for cardiovascular disease, 1.37 (1.14 to 1.65) in women and 1.07 (0.89 to 1.30) in men for cancer, and 1.59 (1.38 to 1.82) in women and 1.10 (0.95 to 1.29) in men for other causes. The trajectory-mortality association was generally weaker among ever smokers than among never smokers (for all cause mortality: P for interaction <0.001 in women and 0.06 in men). When participants were classified jointly according to trajectories and history of type 2 diabetes, the increased risk of death associated with heavier body shape trajectories was more pronounced among participants with type 2 diabetes than those without diabetes, and those in the heavy-stable/increase trajectory and with a history of diabetes had the highest risk of death.
Conclusions: Using the trajectory approach, we found that heavy body shape from age 5 up to 50, especially the increase in middle life, was associated with higher mortality. In contrast, people who maintained a stably lean body shape had the lowest mortality. These results indicate the importance of weight management across the lifespan.
Published by the BMJ Publishing Group Limited. For permission to use (where not already granted under a licence) please go to http://group.bmj.com/group/rights-licensing/permissions.
Conflict of interest statement
Competing interests: All authors have completed the ICMJE uniform disclosure form at
Figures

Comment in
-
Body mass index and mortality: understanding the patterns and paradoxes.BMJ. 2016 May 4;353:i2433. doi: 10.1136/bmj.i2433. BMJ. 2016. PMID: 27146663 No abstract available.
Comment on
-
Use of the Danish Adoption Register for the study of obesity and thinness.Res Publ Assoc Res Nerv Ment Dis. 1983;60:115-20. Res Publ Assoc Res Nerv Ment Dis. 1983. PMID: 6823524 No abstract available.
References
-
- Fryar CD, Carroll MD, Ogden CL. Prevalence of overweight and obesity among children and adolescents: United States, 1963-1965 through 2011-2012. 2014. http://www.cdc.gov/nchs/data/hestat/obesity_child_11_12/obesity_child_11....
-
- Ogden CL, Carroll MD, Kit BK, Flegal KM. Prevalence of childhood and adult obesity in the United States, 2011-2012. JAMA 2014;311:806-14. 10.1001/jama.2014.732 pmid:24570244. - DOI - PMC - PubMed
-
- Ogden CL, Carroll MD. Prevalence of overweight, obesity, and extreme obesity among adults: United States, trends 1960-1962 through 2007-2008. 2010. http://www.cdc.gov/NCHS/data/hestat/obesity_adult_07_08/obesity_adult_07....
-
- Singh AS, Mulder C, Twisk JW, van Mechelen W, Chinapaw MJ. Tracking of childhood overweight into adulthood: a systematic review of the literature. Obes Rev 2008;9:474-88. 10.1111/j.1467-789X.2008.00475.x pmid:18331423. - DOI - PubMed
-
- Berrington de Gonzalez A, Hartge P, Cerhan JR, et al. Body-mass index and mortality among 1.46 million white adults. N Engl J Med 2010;363:2211-9. 10.1056/NEJMoa1000367 pmid:21121834. - DOI - PMC - PubMed
Publication types
MeSH terms
LinkOut - more resources
Full Text Sources
Other Literature Sources
Medical