

The influence of temperature on mortality and its Lag effect: a study in four Chinese cities with different latitudes
- PMID: 27146378
- PMCID: PMC4855424
- DOI: 10.1186/s12889-016-3031-z
The influence of temperature on mortality and its Lag effect: a study in four Chinese cities with different latitudes
Abstract
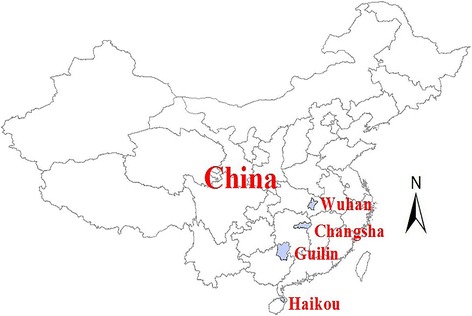
Background: Global climate change is one of the most serious environmental issues faced by humanity, and the resultant change in frequency and intensity of heat waves and cold spells could increase mortality. The influence of temperature on human health could be immediate or delayed. Latitude, relative humidity, and air pollution may influence the temperature-mortality relationship. We studied the influence of temperature on mortality and its lag effect in four Chinese cities with a range of latitudes over 2008-2011, adjusting for relative humidity and air pollution.
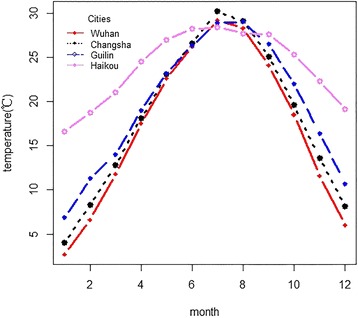
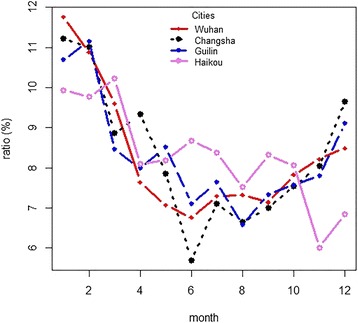
Methods: We recorded the city-specific distributions of temperature and mortality by month and adopted a Poisson regression model combined with a distributed lag nonlinear model to investigate the lag effect of temperature on mortality.
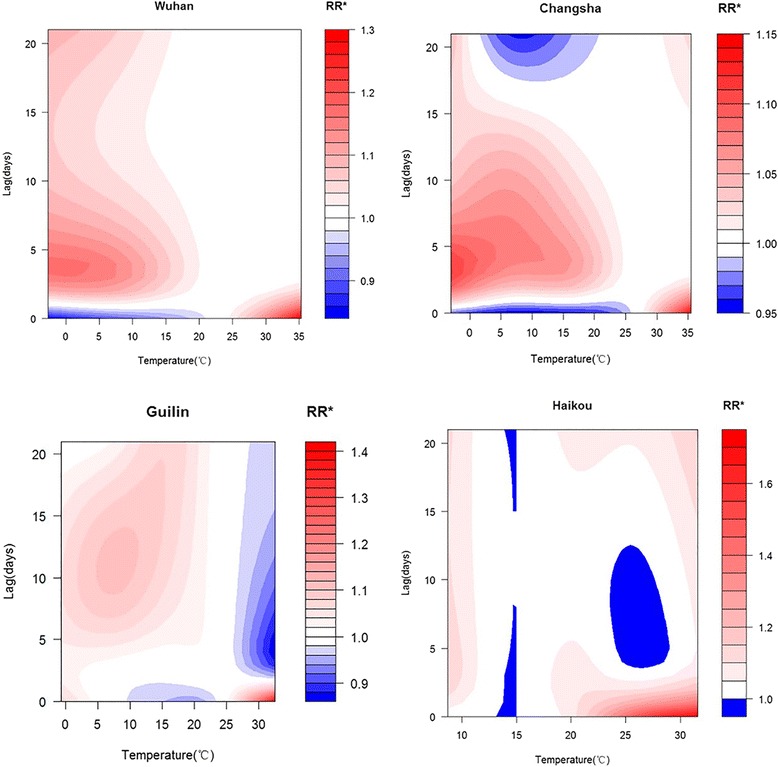
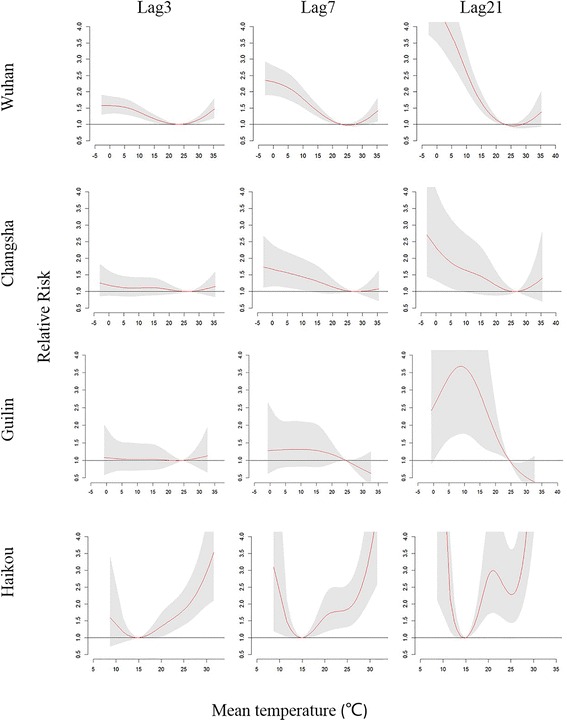
Results: We found that the coldest months in the study area are December through March and the hottest months are June through September. The ratios of deaths during cold months to hot months were 1.43, 1.54, 1.37 and 1.12 for the cities of Wuhan, Changsha, Guilin and Haikou, respectively. The effects of extremely high temperatures generally persisted for 3 days, whereas the risk of extremely low temperatures could persist for 21 days. Compared with the optimum temperature of each city, at a lag of 21 days, the relative risks (95 % confidence interval) of extreme cold temperatures were 4.78 (3.63, 6.29), 2.38 (1.35, 4.19), 2.62 (1.15, 5.95) and 2.62 (1.44, 4.79) for Wuhan, Changsha, Guilin and Haikou, respectively. The respective risks were 1.35 (1.18, 1.55), 1.19 (0.96, 1.48), 1.22 (0.82, 1.82) and 2.47 (1.61, 3.78) for extreme hot temperatures, at a lag of 3 days.
Conclusions: Temperature-mortality relationships vary among cities at different latitudes. Local governments should establish regional prevention and protection measures to more effectively confront and adapt to local climate change. The effects of hot temperatures predominantly occur over the short term, whereas those of cold temperatures can persist for an extended number of days.
Keywords: China; Lag effect; Latitude; Temperature–mortality relationship.
Figures
References
-
- Intergovernmental Panel on Climate Change. Climate Change 2013: the Physical Science Basis. Working Group I Contribution to the Fifth Assessment Report of the Intergovernmental Panel on Climate Change. Cambridge: Cambridge University Press, 2013; 37–89.
MeSH terms
LinkOut - more resources
Full Text Sources
Other Literature Sources
