. 2016 May 5:6:25156.
doi: 10.1038/srep25156.

Learning Bayesian Networks from Correlated Data

Affiliations

Learning Bayesian Networks from Correlated Data

Harold Bae et al. Sci Rep. .

Abstract

Bayesian networks are probabilistic models that represent complex distributions in a modular way and have become very popular in many fields. There are many methods to build Bayesian networks from a random sample of independent and identically distributed observations. However, many observational studies are designed using some form of clustered sampling that introduces correlations between observations within the same cluster and ignoring this correlation typically inflates the rate of false positive associations. We describe a novel parameterization of Bayesian networks that uses random effects to model the correlation within sample units and can be used for structure and parameter learning from correlated data without inflating the Type I error rate. We compare different learning metrics using simulations and illustrate the method in two real examples: an analysis of genetic and non-genetic factors associated with human longevity from a family-based study, and an example of risk factors for complications of sickle cell anemia from a longitudinal study with repeated measures.


Figures

Figure 1
Figure 1. Example of Ignoring Within-Cluster Correlations When Learning BN.
2,000 simulated data sets were generated using the network structure shown on the left and assuming normal distributions for the 5 variables. In 1,000 sets, the observations were IID, and in the remaining 1,000 sets data were generated from 581 independent clusters, with observations correlated within clusters. The table summarizes the number of times the true network was selected in 1,000 simulations with IID observations and 1,000 simulations with correlated data, the false positive rates, and family-wise error rates using three common model selection metrics and a forward search. False positive rates were defined as the number of additional or missing edges over the total number of tests, and family-wise error rates were defined as the probability of one or more errors in the overall search. BIC: Bayesian Information Criterion; AIC: Akaike Information Criterion; LRT: Likelihood Ratio Test at α = 0.05.
Figure 2
Figure 2. Example of BN with 3 observable variables (Y1, Y2, Y3) and parameter vectors θ = (θ1, θ2, θ3).
If there are no missing data, the observations are independent, and the prior distribution of the parameters follow Hyper-Markov law, then the marginal likelihood p(D|M) factorizes into a product of 3 local marginal likelihood functions.
Figure 3
Figure 3. An Example Pedigree and Corresponding Additive Genetic Relationship Matrix.
The kinship matrices contain pairwise kinship coefficients between pairs of family members and these coefficients represent the probability that two individuals share the same gene allele by identity by descent. The covariance between two family members with kinship coefficient kij is 2kijγ2 where γ2 represents the genetic variance.
Figure 4
Figure 4
Left panel: common parameterization of a simple directed graphical model with 3 observable, Gaussian variables (Y1, Y2, Y3), conditional of the parameter vector θ. Nodes in orange are the parameters that define the conditional parent-children distribution of the observable variables (fixed effects), while the nodes in yellow are nuisance parameters. Right panel: our proposed parameterization when both the dependency structure and conditional probability distributions need to be estimated from correlated data. The random effects α (blue nodes) have probability distributions that depend on parameters γ (lavender nodes). Both parameters γ and random effects α are used to model the correlation between observations as in Equation (4).
Figure 5
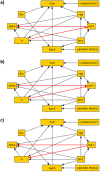
Figure 5. Top 3 BNs built using the proposed parameterization that dissect the associations of SNPs in genes of the IIS pathway through effects on blood biomarkers.
The different edges among the three networks are colored in red.
Figure 6
Figure 6. Top 3 BNs built ignoring the familiar correlations in the data used in Fig. 5.
The different edges among the three networks are colored in red. Compared to the BNs in Fig. 5, two additional SNPs rs17224116 and rs10048024 are added to the models.
Figure 7
Figure 7
Left Panel: Top BN using the proposed approach and associated Markov Blanket of each node. Right Panel: Top BN built ignoring correlations due to the repeated measurements on the same subjects and associated Markov Blanket of each node. Additional variables in the Markov Blanket as a result of ignoring correlations are colored red. Hg: hemoglobin; SGOT: serum glutamic oxaloacetic transaminase; DBP: diastolic blood pressure; Retic: reticulocyte count; Platelet: platelet count; RBC: red blood cells; WBC: white blood cells; HbF: fetal hemoglobin; MCV: mean corpuscular volume.

Similar articles

Cited by

References

    1. Friedman N., Linial M., Nachman I. & Pe’er D. Using bayesian networks to analyze expression data. Journal of Computational Biology 7, 601–20 (2000). - PubMed
    1. Lauritzen S. L. & Sheehan N. A. Graphical models for genetic analysis. Statistical Science 18, 489–514 (2004).
    1. Sebastiani P., Ramoni M. F., Nolan V., Baldwin C. T. & Steinberg M. H. Genetic dissection and prognostic modeling of overt stroke in sickle cell anemia. Nature Genetics 37, 435–40 (2005). - PMC - PubMed
    1. Schadt E. E. et al. An integrative genomics approach to infer causal associations between gene expression and disease. Nature Genetics 37, 710–7 (2005). - PMC - PubMed
    1. Thomas D. Gene-environment-wide association studies: emerging approaches. Nature Review Genetics 11, 259–272 (2010). - PMC - PubMed

Publication types