

Spatial And Temporal Trends Of Organic Pollutants In Vegetation From Remote And Rural Areas
- PMID: 27146722
- PMCID: PMC4857197
- DOI: 10.1038/srep25446
Spatial And Temporal Trends Of Organic Pollutants In Vegetation From Remote And Rural Areas
Abstract
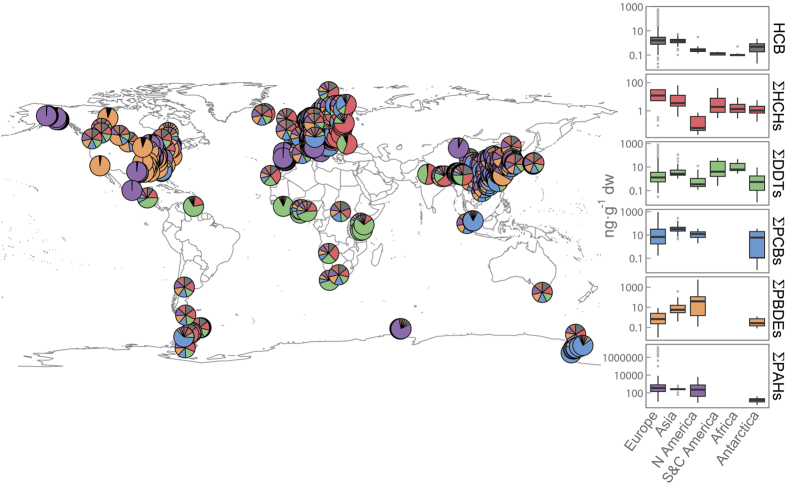
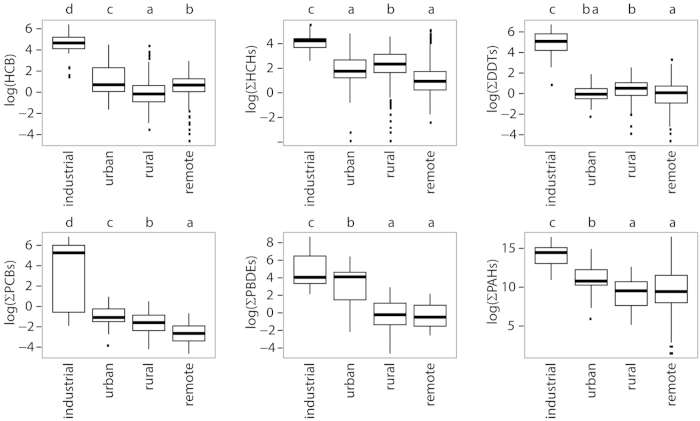
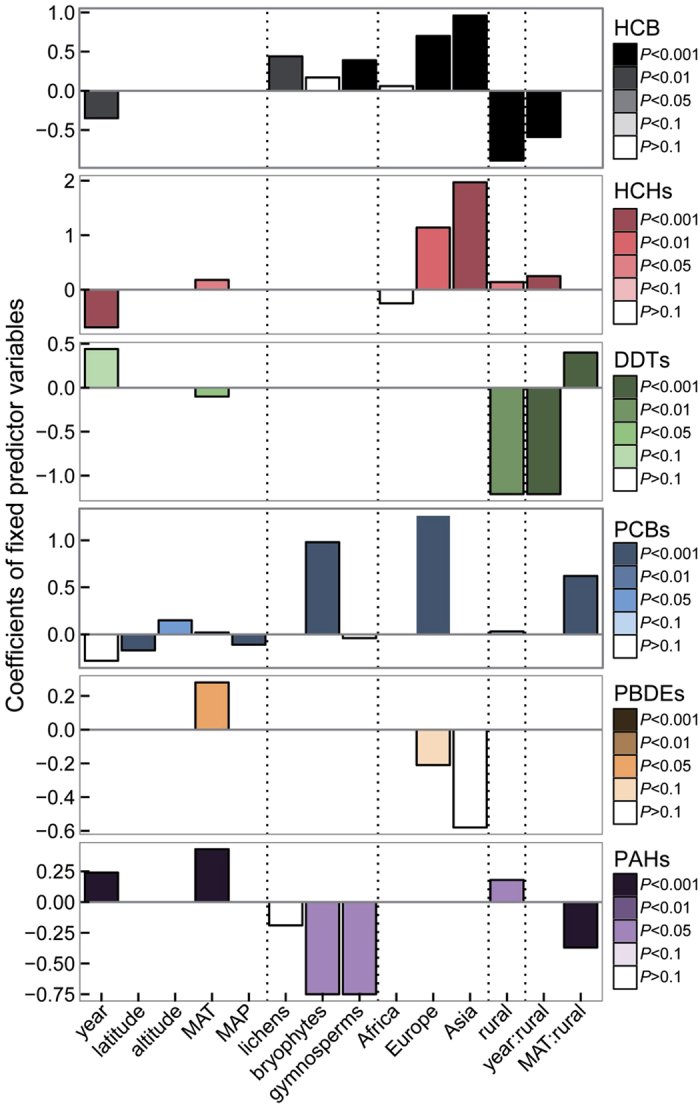
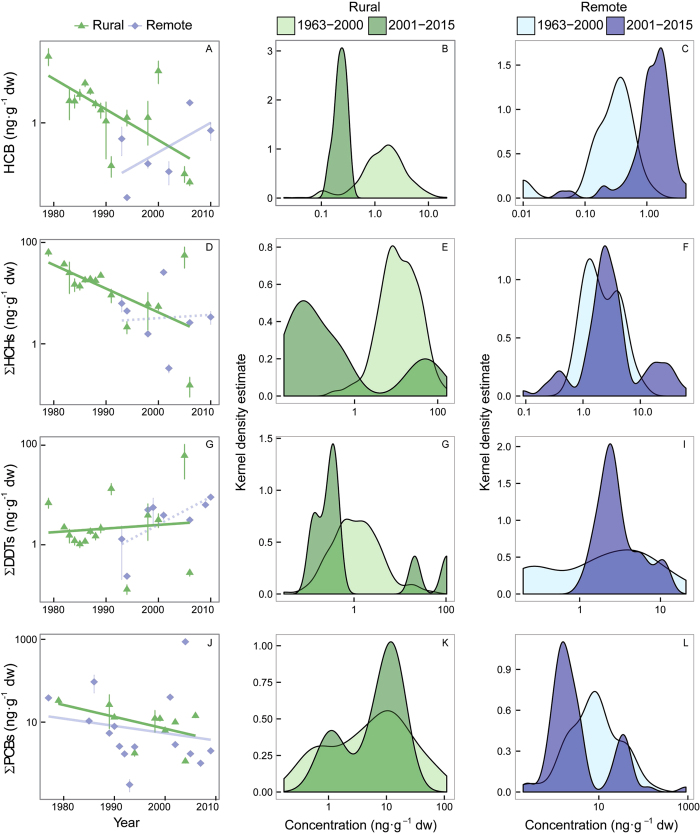
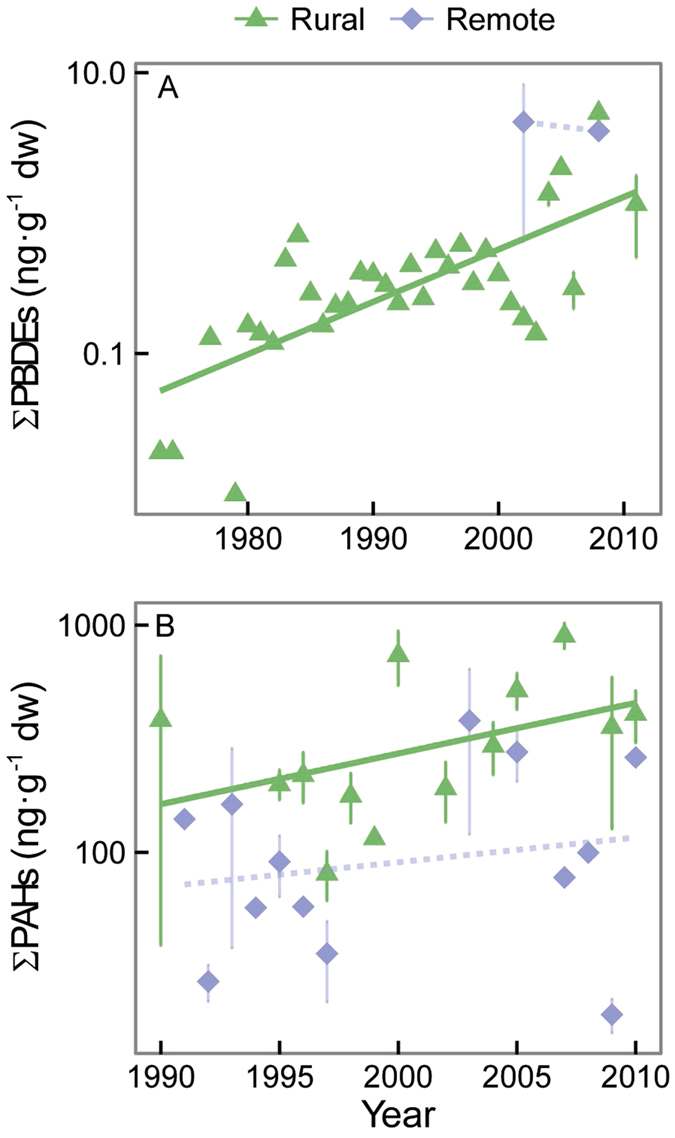
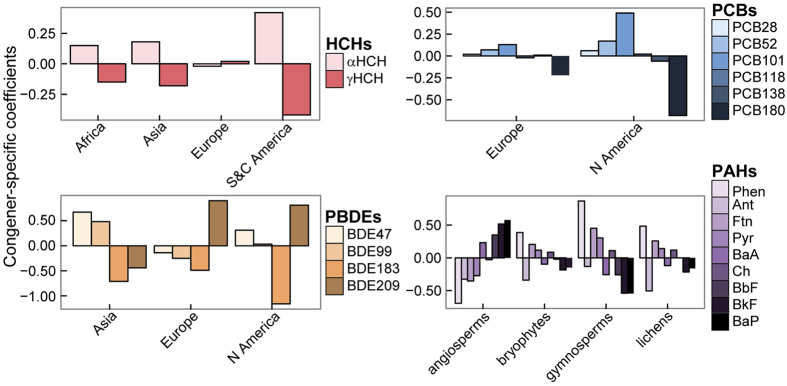
Persistent organic pollutants (POPs) and polycyclic aromatic hydrocarbons (PAHs) used in agricultural, industrial, and domestic applications are widely distributed and bioaccumulate in food webs, causing adverse effects to the biosphere. A review of published data for 1977-2015 for a wide range of vegetation around the globe indicates an extensive load of pollutants in vegetation. On a global perspective, the accumulation of POPs and PAHs in vegetation depends on the industrialization history across continents and distance to emission sources, beyond organism type and climatic variables. International regulations initially reduced the concentrations of POPs in vegetation in rural areas, but concentrations of HCB, HCHs, and DDTs at remote sites did not decrease or even increased over time, pointing to a remobilization of POPs from source areas to remote sites. The concentrations of compounds currently in use, PBDEs and PAHs, are still increasing in vegetation. Differential congener specific accumulation is mostly determined by continent-in accordance to the different regulations of HCHs, PCBs and PBDEs in different countries-and by plant type (PAHs). These results support a concerning general accumulation of toxic pollutants in most ecosystems of the globe that for some compounds is still far from being mitigated in the near future.
Figures
Similar articles
-
Occurrence of persistent organic pollutants in air at different sites in the province of Córdoba, Argentina.Environ Sci Pollut Res Int. 2019 Jun;26(18):18379-18391. doi: 10.1007/s11356-019-05088-z. Epub 2019 May 1. Environ Sci Pollut Res Int. 2019. PMID: 31044375
-
Lake sediment records of persistent organic pollutants and polycyclic aromatic hydrocarbons in southern Siberia mirror the changing fortunes of the Russian economy over the past 70 years.Environ Pollut. 2018 Nov;242(Pt A):528-538. doi: 10.1016/j.envpol.2018.07.005. Epub 2018 Jul 3. Environ Pollut. 2018. PMID: 30005265
-
Long-range atmospheric transport of persistent organic pollutants to remote lacustrine environments.Sci Total Environ. 2014 Sep 15;493:505-20. doi: 10.1016/j.scitotenv.2014.05.002. Epub 2014 Jun 24. Sci Total Environ. 2014. PMID: 24971459
-
Terrestrial mosses as biomonitors of atmospheric POPs pollution: a review.Environ Pollut. 2013 Feb;173:245-54. doi: 10.1016/j.envpol.2012.10.005. Epub 2012 Nov 30. Environ Pollut. 2013. PMID: 23202982 Review.
-
Current levels, sources, and risks of human exposure to PAHs, PBDEs and PCBs in South American outdoor air: A critical review.Environ Res. 2025 Apr 1;270:120941. doi: 10.1016/j.envres.2025.120941. Epub 2025 Jan 23. Environ Res. 2025. PMID: 39862950 Review.
Cited by
-
Genome-wide identification and characterization of major latex-like protein genes responsible for crop contamination in Cucurbita pepo.Mol Biol Rep. 2022 Aug;49(8):7773-7782. doi: 10.1007/s11033-022-07602-y. Epub 2022 Jun 1. Mol Biol Rep. 2022. PMID: 35648252
-
Combining Spatial, Genetic, and Environmental Risk Data to Define and Prioritize In Situ Conservation Units.Ecol Evol. 2025 May 26;15(5):e71251. doi: 10.1002/ece3.71251. eCollection 2025 May. Ecol Evol. 2025. PMID: 40421059 Free PMC article.
-
Biological Traits and the Transfer of Persistent Organic Pollutants through River Food Webs.Environ Sci Technol. 2019 Nov 19;53(22):13246-13256. doi: 10.1021/acs.est.9b05891. Epub 2019 Nov 6. Environ Sci Technol. 2019. PMID: 31647636 Free PMC article.
-
Major latex-like proteins show pH dependency in their binding to hydrophobic organic pollutants.J Pestic Sci. 2023 Aug 20;48(3):71-77. doi: 10.1584/jpestics.D23-014. J Pestic Sci. 2023. PMID: 37745171 Free PMC article.
-
A Review of Plant Vacuoles: Formation, Located Proteins, and Functions.Plants (Basel). 2019 Sep 5;8(9):327. doi: 10.3390/plants8090327. Plants (Basel). 2019. PMID: 31491897 Free PMC article. Review.
References
-
- WHO. Health risks of persistent organic pollutants from long-range transboundary air pollution. World Health Organization/IPCS, 1-274 (2003).
Publication types
MeSH terms
Substances
Grants and funding
LinkOut - more resources
Full Text Sources
Other Literature Sources
