

doi: 10.1002/adma.201600383.
Epub 2016 May 4.
Multifunctional Charge-Transfer Single Crystals through Supramolecular Assembly
Affiliations
- PMID: 27146726
- PMCID: PMC7798091
- DOI: 10.1002/adma.201600383
Item in Clipboard
Multifunctional Charge-Transfer Single Crystals through Supramolecular Assembly
Adv Mater.
2016 Jul.
Abstract
Centimeter-sized segregated stacking TTF-C60 single crystals are crystallized by a mass-transport approach combined with solvent-vapor evaporation for the first time. The intermolecular charge-transfer interaction in the long-range ordered superstructure enables the crystals to demonstrate external stimuli-controlled multifunctionalities and angle/electrical-potential-dependent luminescence.
Keywords: charge transfer; magnetoelectrics; materials design; self-assembly.
© 2016 WILEY-VCH Verlag GmbH & Co. KGaA, Weinheim.
Figures
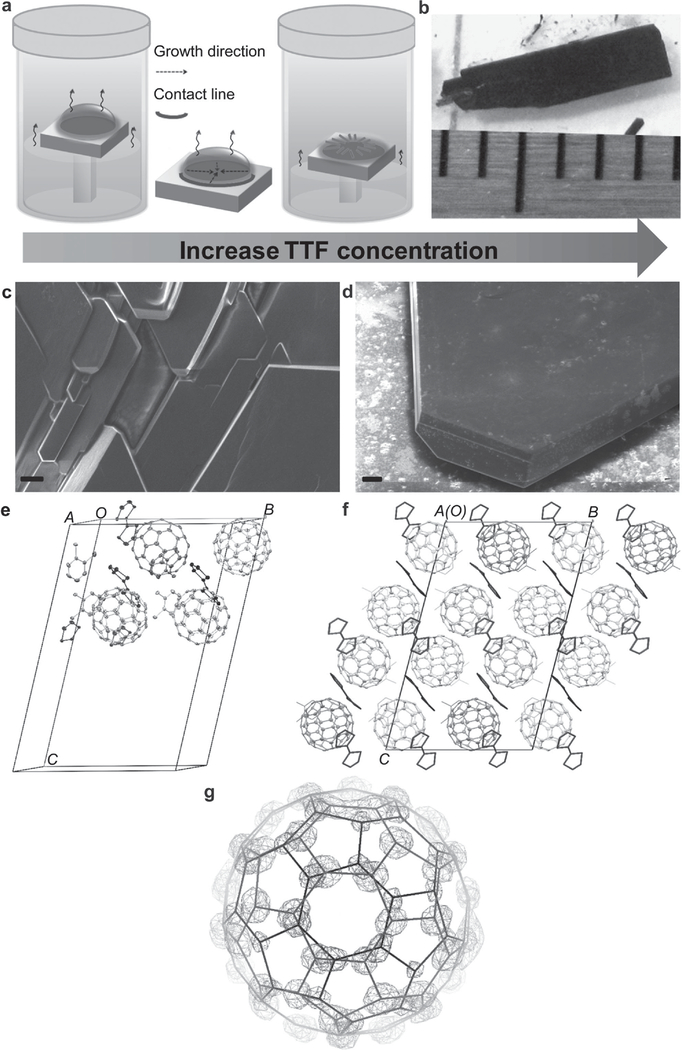
Schematic illustration of the crystal growth methods, the morphology, structure, and packing of TTF-C60 charge-transfer crystals (TCCTs). a) Crystal growth scheme. b) Photograph of TCCTs at the highest concentration of TTF. c,d) SEM images of TCCTs. TTF concentrations are 16.7 and 25 mg mL−1, respectively. The C60 concentration is maintained at 25 mg mL−1. The scale bars for SEM images are 10 μm. e) Crystal structure of C60-TTF-DCB complex in an asymmetric unit without disordered parts. The 50% probability ellipsoids of thermal vibrations are shown. The four C60 molecules have different orientations and these are colored in red, cyan, blue, and purple. The crystallographic nonequivalent molecules are shown in different colors. f) Projection of C60-TTF crystal packing along a axis. g) Double conformation of C60 on the site close to the middle of b cell edge created in crystallographic object-oriented toolkit (COOT).[46,48] The high occupancy (0.81) part is presented as blue line with the 2Fo-Fc electron density map in blue mesh at 2σ level. The low occupancy part (0.19) is presented as green line with Fo-Fc difference electron density map in green mesh at 5σ level. The density map was calculated by SHELXL with the minor part omitted and the major part at 0.81 occupacy fixed. Part (e) was drawn by Mercury,[47] the C60 molecules are shown as ellipsoids, TTF are shown as sticks, and DCBs are shown as wireframe.
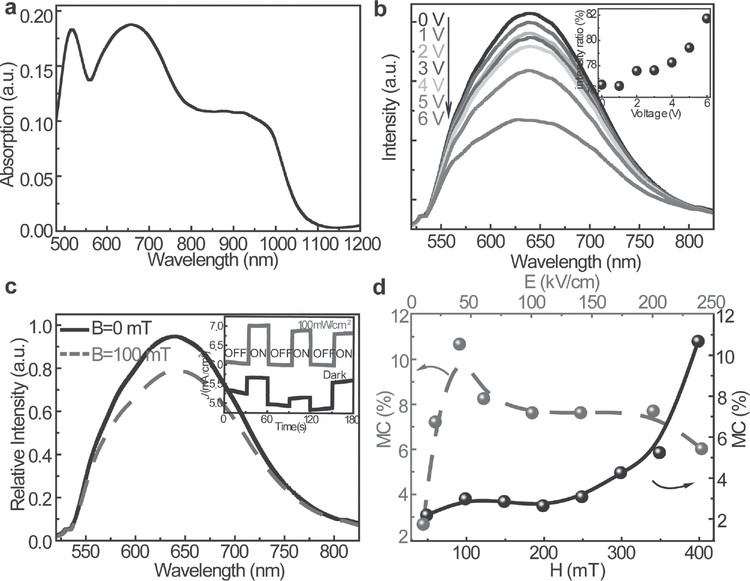
Optical, electrical properties, magnetic field effect on photoluminescence properties and MC of TCCTs. a) Absorption spectra of TCCTs. b) Potential-dependent photoluminescence spectra for emission polarized at 0° relative to the excitation polarization. The inset in (b) is the ratio of the emission intensities collected at 90° and 0° as a function of applied potential. c) Magnetic-field-dependent photoluminescence spectra at 0° of emission. The inset is the dark and photoexcited MC. d) Electric-field and magnetic-field-dependent MC change, respectively.
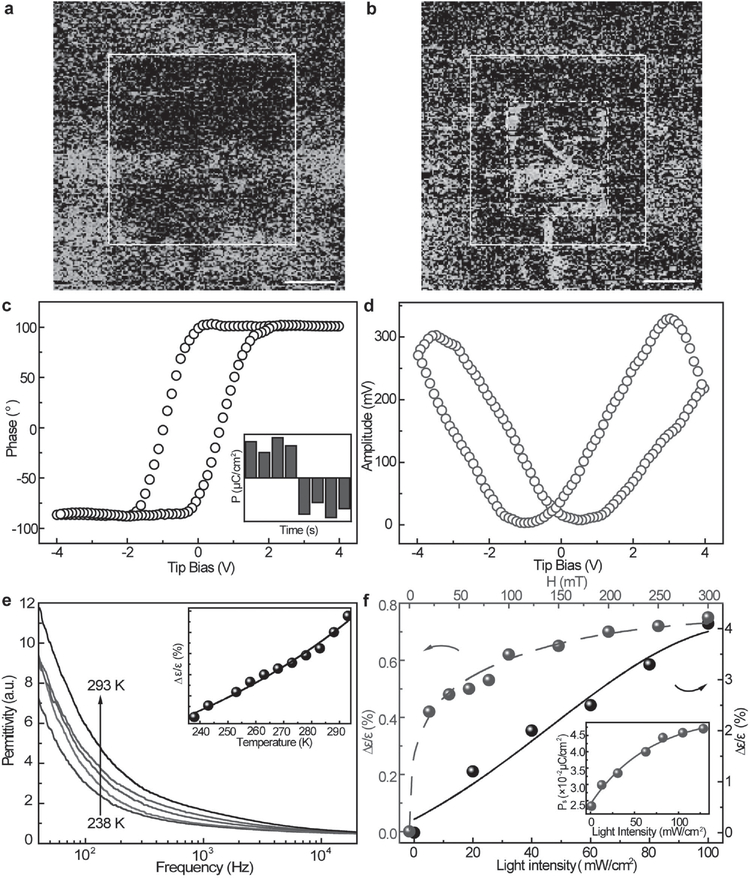
Ferroelectric and dielectric properties of TCCTs. a,b) Piezoelectric force microscopy image. The square in the center is the polarized area under a voltage of 54 and −72 kV cm−1, respectively. The scale bar is 5 μm. c,d) The phase and amplitude hysteresis loop for piezoelectric response. The inset in (c) is the PUND polarization measurement of TCCTs. e) Frequency-dependent permittivity at different temperatures. The inset is the temperature-dependent permittivity at 100 Hz. f) Magnetic-field and light-intensity-dependent permittivity change. The inset is the light-intensity-dependent polarization value change.
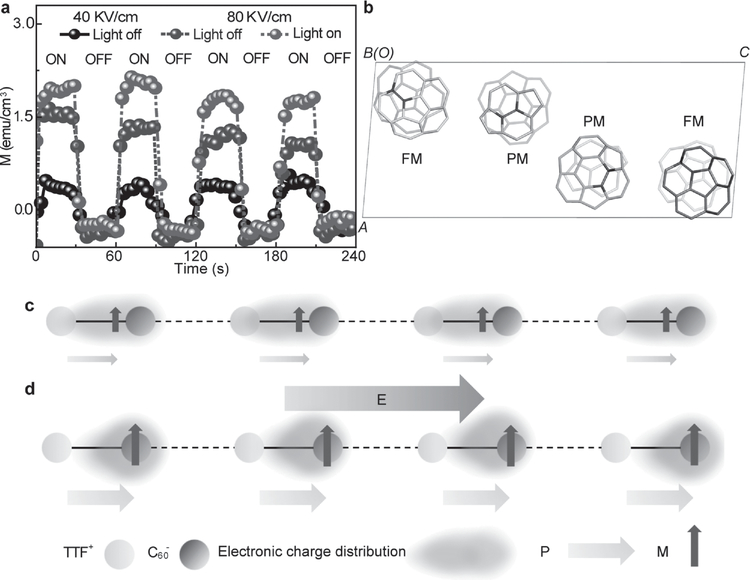
Magnetism and magnetoelectric coupling properties of TCCTs. a) Electric field tuning of magnetization of TCCTs under dark and photoexcitation conditions at different electric field. The light intensity is 70 mW cm−2. b) The orientations related to ferromeagnetism and paramagnetism by projecting the structure of C60 molecules along 010 direction created by PyMOL.[48] The 6–6 double bonds in upper layer are colored in red. c) The configurations of charge and spin in TCCTs. The interactions between molecules are presented as 1D chain. Purple circles, shaded yellow ovals, gray arrows, and purple arrows represent molecules, electron distributions, electric dipoles, and spins, respectively, d) The loading of electric field along the chain direction with the enhancement of both polarization and magnetization.
Similar articles
-
Integrated Charge Transfer in Organic Ferroelectrics for Flexible Multisensing Materials.Small. 2016 Sep;12(33):4502-7. doi: 10.1002/smll.201600980. Epub 2016 Jul 5. Small. 2016. PMID: 27378088
-
Stimuli-Responsive Trimorphs and Charge-Transfer Complexes of a Twisted Molecular Donor.Langmuir. 2021 Jul 6;37(26):8024-8036. doi: 10.1021/acs.langmuir.1c01172. Epub 2021 Jun 22. Langmuir. 2021. PMID: 34155888
-
Porous Crystalline Materials Based on Tetrathiafulvalene and Its Analogues: Assembly, Charge Transfer, and Applications.Acc Chem Res. 2024 Jul 2;57(13):1851-1869. doi: 10.1021/acs.accounts.4c00228. Epub 2024 Jun 20. Acc Chem Res. 2024. PMID: 38902854
-
Self-assembly as a key player for materials nanoarchitectonics.Sci Technol Adv Mater. 2019 Jan 31;20(1):51-95. doi: 10.1080/14686996.2018.1553108. eCollection 2019. Sci Technol Adv Mater. 2019. PMID: 30787960 Free PMC article. Review.
-
Accelerating Cellulose Nanocrystal Assembly into Chiral Nanostructures.ACS Nano. 2023 Aug 8;17(15):14283-14308. doi: 10.1021/acsnano.3c03797. Epub 2023 Jul 18. ACS Nano. 2023. PMID: 37464327 Review.
Cited by
-
Organic Cocrystals: Recent Advances and Perspectives for Electronic and Magnetic Applications.Front Chem. 2021 Dec 9;9:764628. doi: 10.3389/fchem.2021.764628. eCollection 2021. Front Chem. 2021. PMID: 34957044 Free PMC article. Review.
-
Solid-to-Solid Crystallization of Organic Thin Films: Classical and Nonclassical Pathways.ACS Omega. 2018 Jun 25;3(6):6874-6879. doi: 10.1021/acsomega.8b00153. eCollection 2018 Jun 30. ACS Omega. 2018. Retraction in: ACS Omega. 2019 Jul 19;4(7):12375. doi: 10.1021/acsomega.9b01801. PMID: 31458855 Free PMC article. Retracted.
References
-
- Alves H, Molinari AS, Xie H, Morpurgo AF, Nat. Mater. 2008, 7, 574. - PubMed
-
- Kobayashi K, Horiuchi S, Kumai R, Kagawa F, Murakami Y, Tokura Y, Phys. Rev. Lett. 2012, 108, 237601. - PubMed
-
- Miller JS, Epstein AJ, William MR, Chem. Rev. 1988, 88, 201.
-
- Alves H, Pinto RM, Maçôoas ES, Nat. Commun. 2013, 4, 1842. - PubMed
-
- Ren S, Wuttig M, Adv. Mater. 2012, 24, 724. - PubMed
Grants and funding
LinkOut - more resources
Full Text Sources
Other Literature Sources
