

The common stress responsive transcription factor ATF3 binds genomic sites enriched with p300 and H3K27ac for transcriptional regulation
- PMID: 27146783
- PMCID: PMC4857411
- DOI: 10.1186/s12864-016-2664-8
The common stress responsive transcription factor ATF3 binds genomic sites enriched with p300 and H3K27ac for transcriptional regulation
Abstract
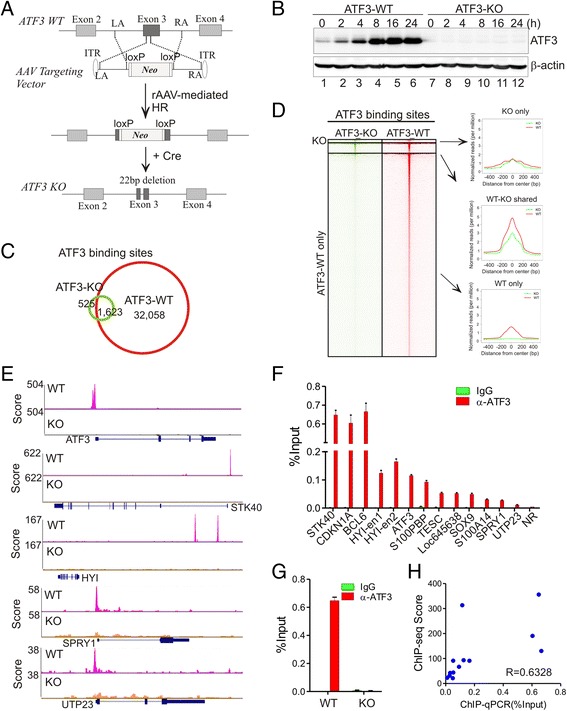
Background: Dysregulation of the common stress responsive transcription factor ATF3 has been causally linked to many important human diseases such as cancer, atherosclerosis, infections, and hypospadias. Although it is believed that the ATF3 transcription activity is central to its cellular functions, how ATF3 regulates gene expression remains largely unknown. Here, we employed ATF3 wild-type and knockout isogenic cell lines to carry out the first comprehensive analysis of global ATF3-binding profiles in the human genome under basal and stressed (DNA damage) conditions.
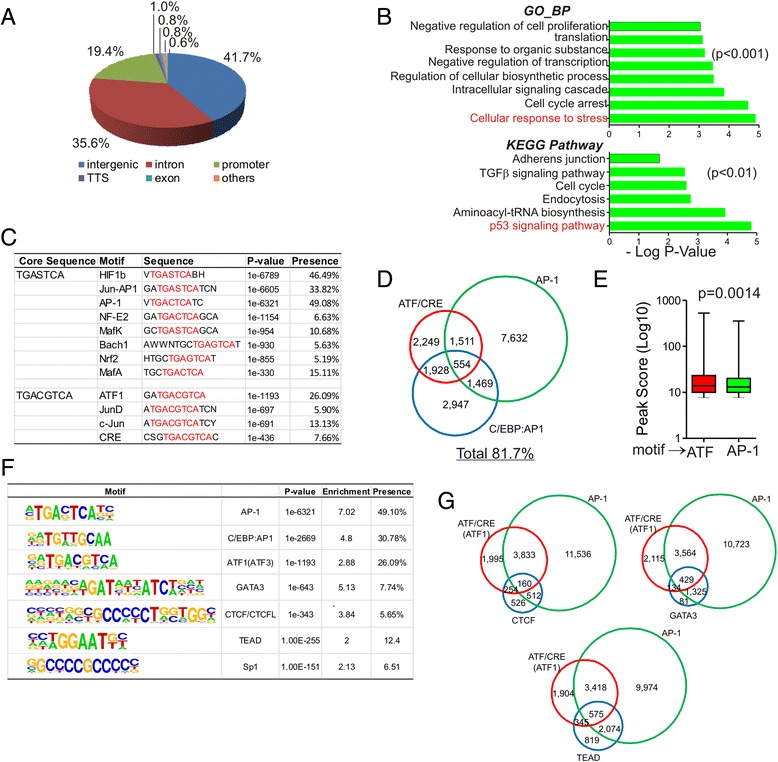
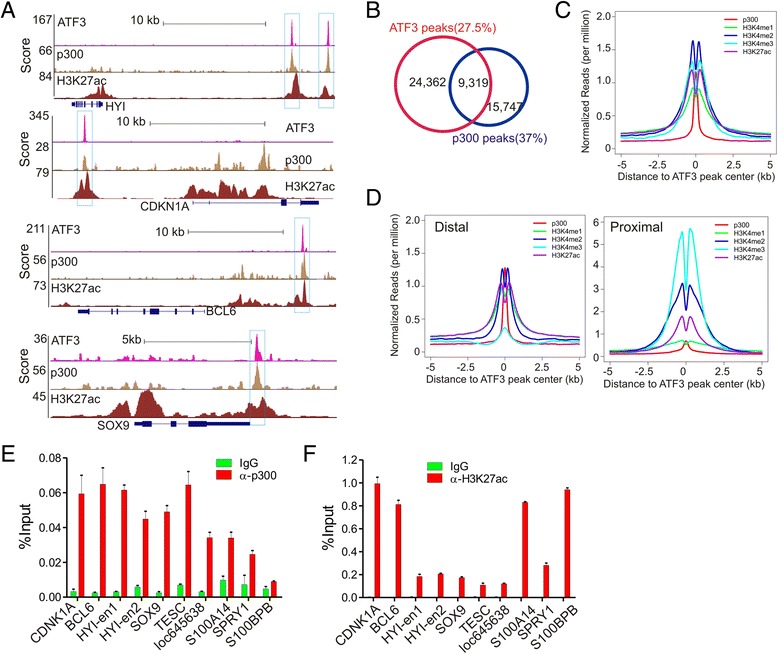
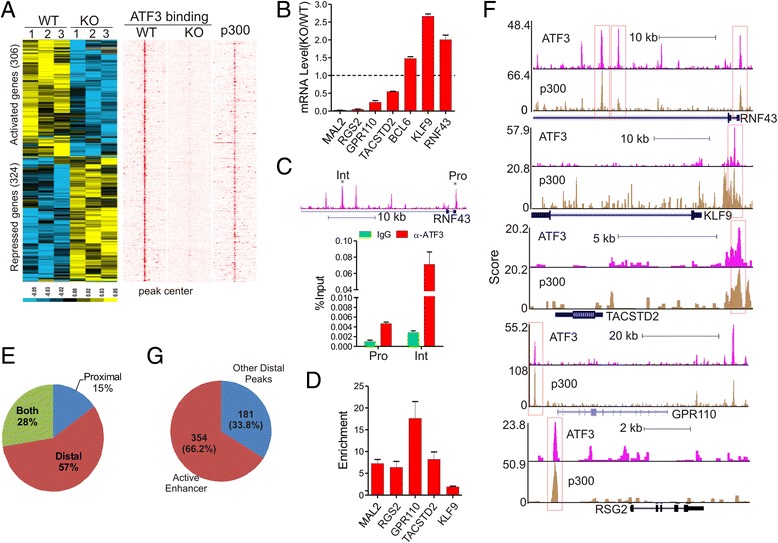
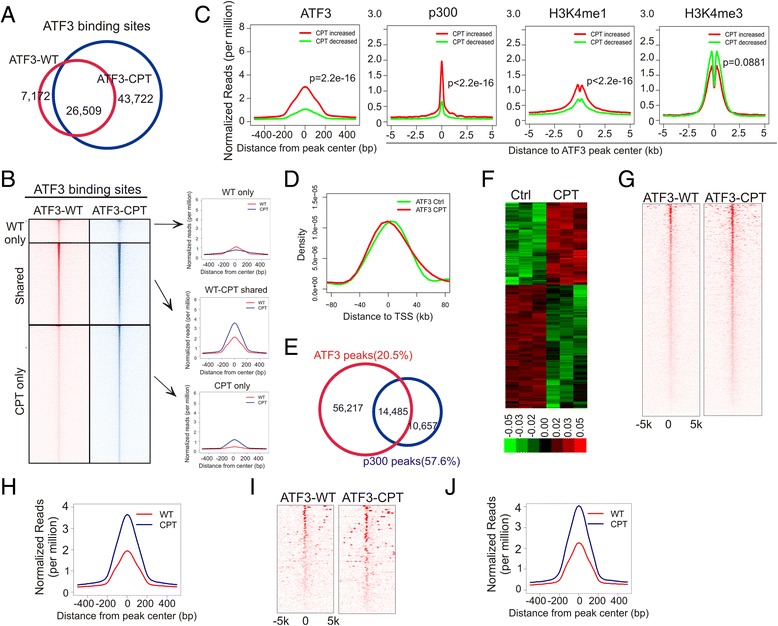
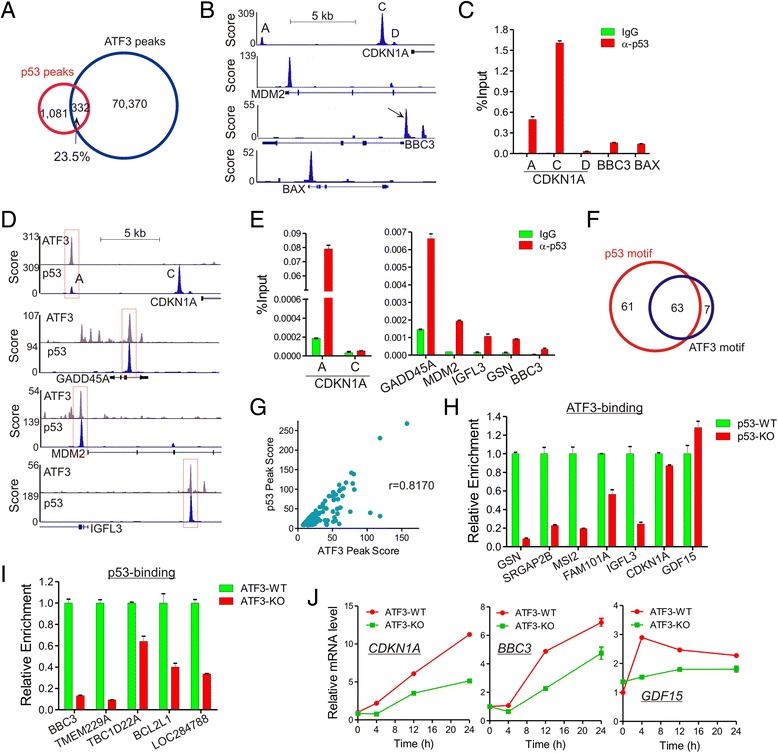
Results: Although expressed at a low basal level, ATF3 was found to bind a large number of genomic sites that are often associated with genes involved in cellular stress responses. Interestingly, ATF3 appears to bind a large portion of genomic sites distal to transcription start sites and enriched with p300 and H3K27ac. Global gene expression profiling analysis indicates that genes proximal to these genomic sites were often regulated by ATF3. While DNA damage elicited by camptothecin dramatically altered the ATF3 binding profile, most of the genes regulated by ATF3 upon DNA damage were pre-bound by ATF3 before the stress. Moreover, we demonstrated that ATF3 was co-localized with the major stress responder p53 at genomic sites, thereby collaborating with p53 to regulate p53 target gene expression upon DNA damage.
Conclusions: These results suggest that ATF3 likely bookmarks genomic sites and interacts with other transcription regulators to control gene expression.
Keywords: ATF3; ChIP-seq; Enhancer; H3K27ac; p300; p53.
Figures
Similar articles
-
Systems analysis of ATF3 in stress response and cancer reveals opposing effects on pro-apoptotic genes in p53 pathway.PLoS One. 2011;6(10):e26848. doi: 10.1371/journal.pone.0026848. Epub 2011 Oct 26. PLoS One. 2011. PMID: 22046379 Free PMC article.
-
The Stress-responsive Gene ATF3 Mediates Dichotomous UV Responses by Regulating the Tip60 and p53 Proteins.J Biol Chem. 2016 May 13;291(20):10847-57. doi: 10.1074/jbc.M115.713099. Epub 2016 Mar 18. J Biol Chem. 2016. PMID: 26994140 Free PMC article.
-
Atf3 deficiency promotes genome instability and spontaneous tumorigenesis in mice.Oncogene. 2018 Jan 4;37(1):18-27. doi: 10.1038/onc.2017.310. Epub 2017 Sep 4. Oncogene. 2018. PMID: 28869597 Free PMC article.
-
Role of activating transcription factor 3 and its interacting proteins under physiological and pathological conditions.Int J Biol Macromol. 2018 Dec;120(Pt A):310-317. doi: 10.1016/j.ijbiomac.2018.08.107. Epub 2018 Aug 23. Int J Biol Macromol. 2018. PMID: 30144543 Review.
-
Regulatory SNPs and transcriptional factor binding sites in ADRBK1, AKT3, ATF3, DIO2, TBXA2R and VEGFA.Transcription. 2014;5(4):e964559. doi: 10.4161/21541264.2014.964559. Epub 2014 Oct 31. Transcription. 2014. PMID: 25483406 Free PMC article. Review.
Cited by
-
Identification and Validation of ATF3 Serving as a Potential Biomarker and Correlating With Pharmacotherapy Response and Immune Infiltration Characteristics in Rheumatoid Arthritis.Front Mol Biosci. 2021 Dec 13;8:761841. doi: 10.3389/fmolb.2021.761841. eCollection 2021. Front Mol Biosci. 2021. PMID: 34966780 Free PMC article.
-
Stress-Inducible Gene Atf3 Dictates a Dichotomous Macrophage Activity in Chemotherapy-Enhanced Lung Colonization.Int J Mol Sci. 2021 Jul 8;22(14):7356. doi: 10.3390/ijms22147356. Int J Mol Sci. 2021. PMID: 34298975 Free PMC article.
-
Integrated Environmental and Genomic Analysis Reveals the Drivers of Local Adaptation in African Indigenous Chickens.Mol Biol Evol. 2021 Sep 27;38(10):4268-4285. doi: 10.1093/molbev/msab156. Mol Biol Evol. 2021. PMID: 34021753 Free PMC article.
-
The mRNA levels of heat shock factor 1 are regulated by thermogenic signals via the cAMP-dependent transcription factor ATF3.J Biol Chem. 2020 May 1;295(18):5984-5994. doi: 10.1074/jbc.RA119.012072. Epub 2020 Mar 17. J Biol Chem. 2020. PMID: 32184357 Free PMC article.
-
Toxicity of cannabidiol and its metabolites in TM3 mouse Leydig cells: a comparison with primary human Leydig cells.Arch Toxicol. 2024 Aug;98(8):2677-2693. doi: 10.1007/s00204-024-03754-x. Epub 2024 Apr 17. Arch Toxicol. 2024. PMID: 38630283 Free PMC article.
References
-
- Creyghton MP, Cheng AW, Welstead GG, Kooistra T, Carey BW, Steine EJ, Hanna J, Lodato MA, Frampton GM, Sharp PA, Boyer LA, Young RA, Jaenisch R. Histone H3K27ac separates active form poised enhancers and predicts developmental state. Proc Natl Acad Sci USA. 2010;107:21931–21936. doi: 10.1073/pnas.1016071107. - DOI - PMC - PubMed
Publication types
MeSH terms
Substances
Grants and funding
LinkOut - more resources
Full Text Sources
Other Literature Sources
Molecular Biology Databases
Research Materials
Miscellaneous
