. 2016 May 5:5:e15690.
doi: 10.7554/eLife.15690.

Set7 mediated Gli3 methylation plays a positive role in the activation of Sonic Hedgehog pathway in mammals

Affiliations

Set7 mediated Gli3 methylation plays a positive role in the activation of Sonic Hedgehog pathway in mammals

Lin Fu et al. Elife. .

Abstract

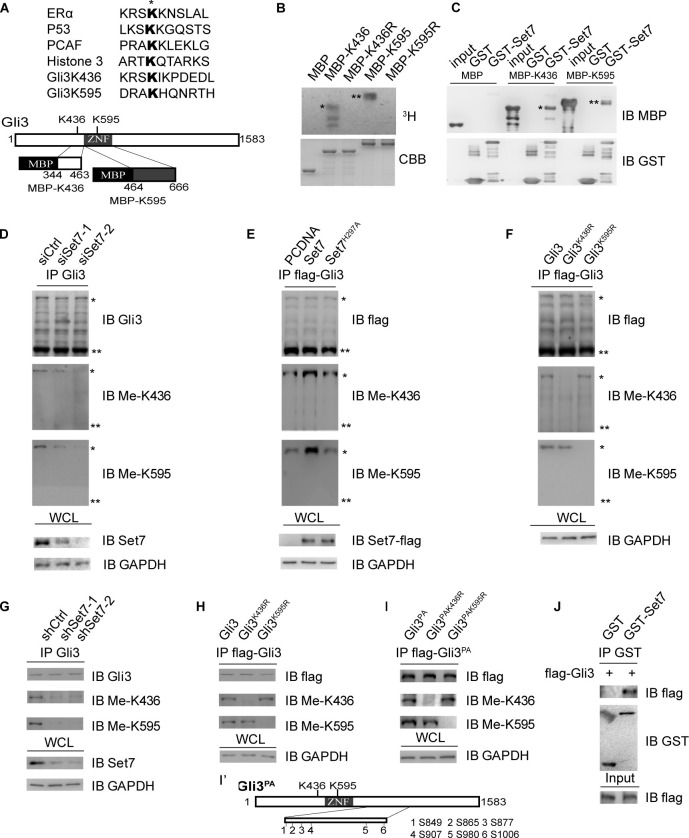
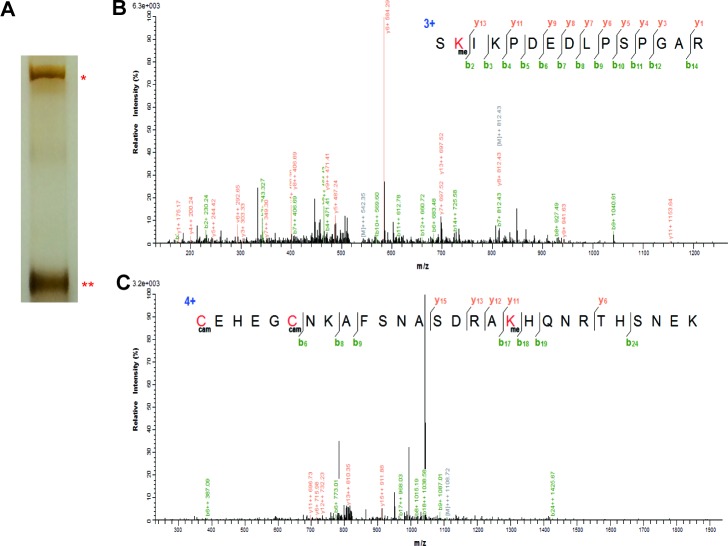
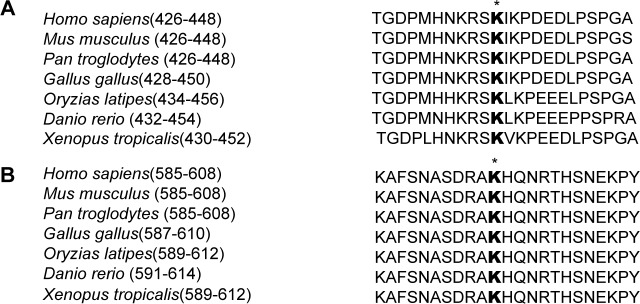
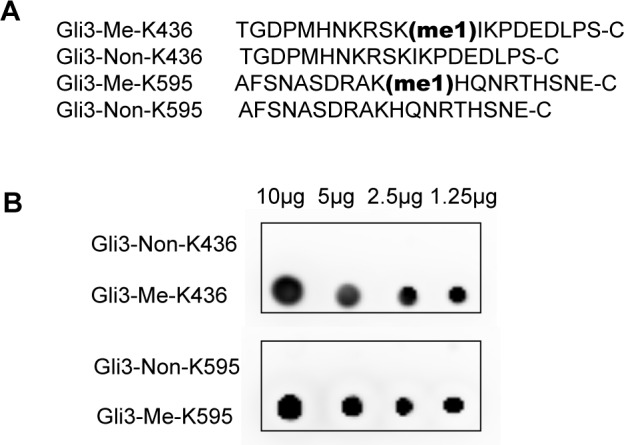
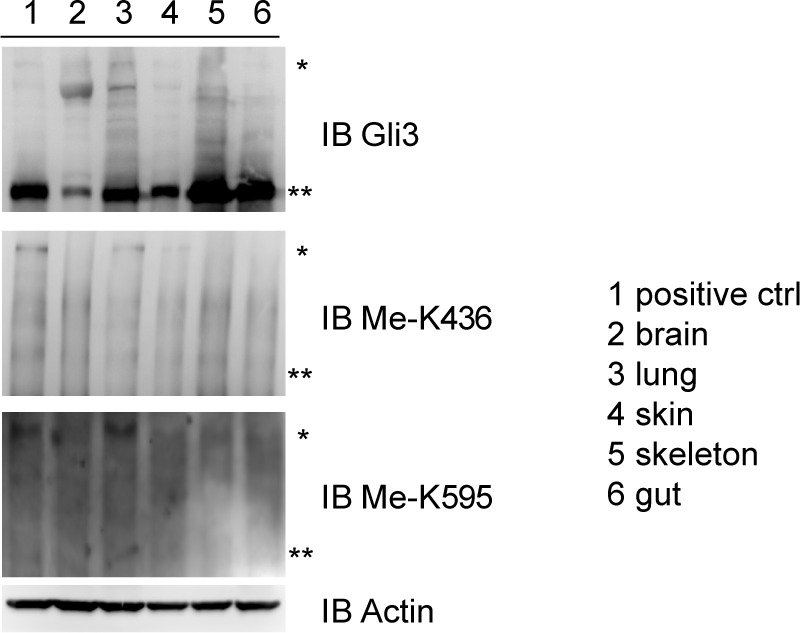
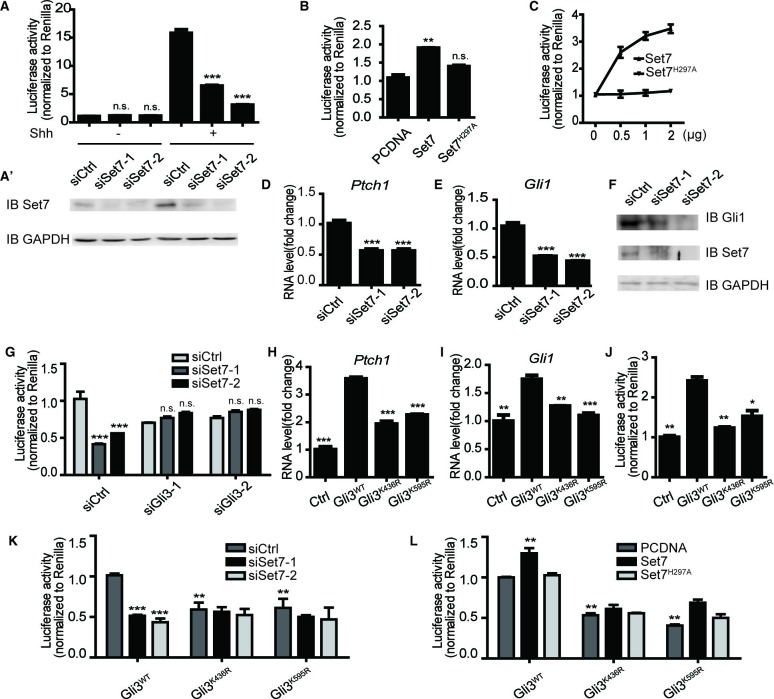
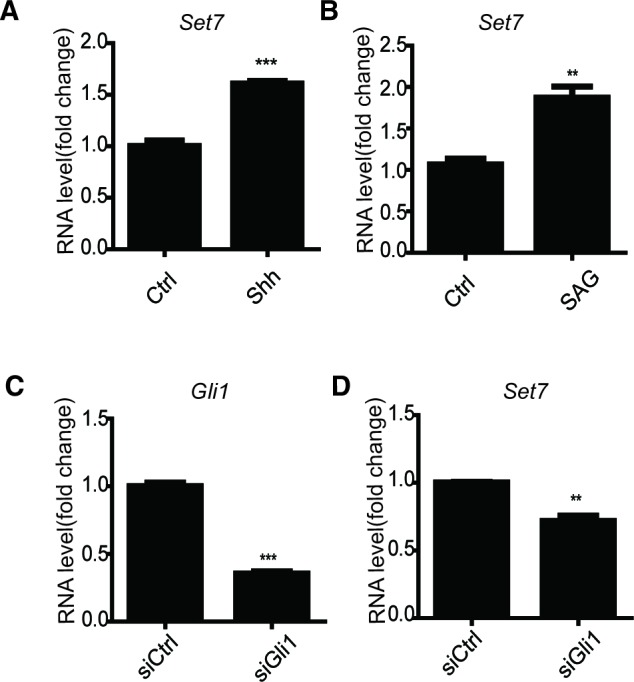
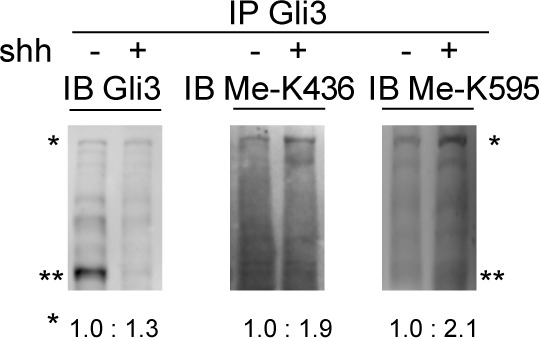
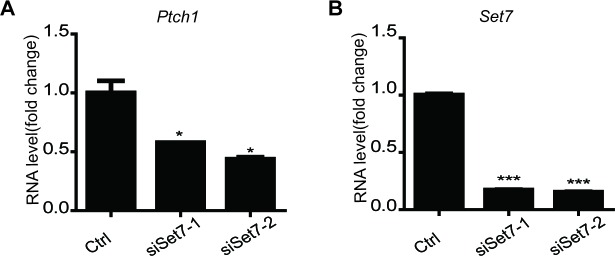
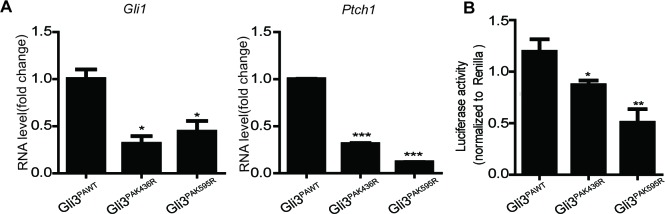
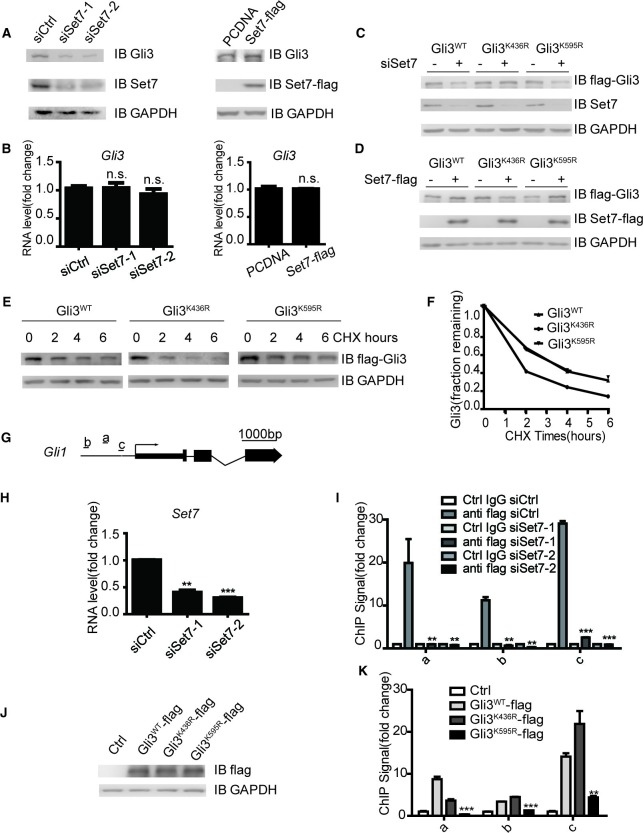
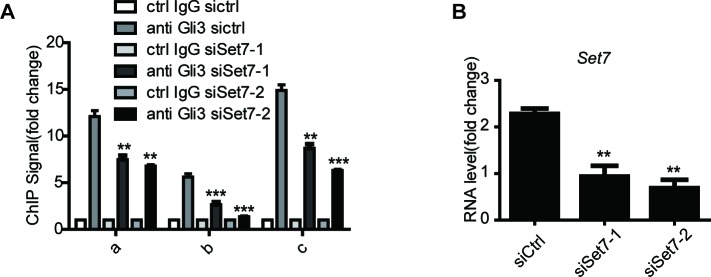
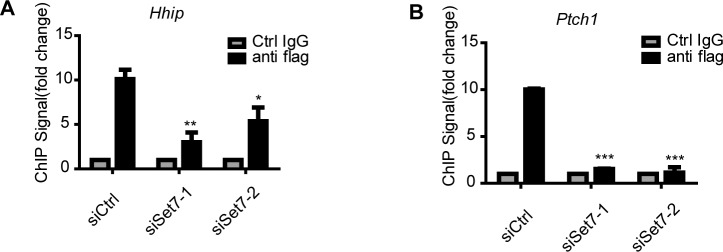
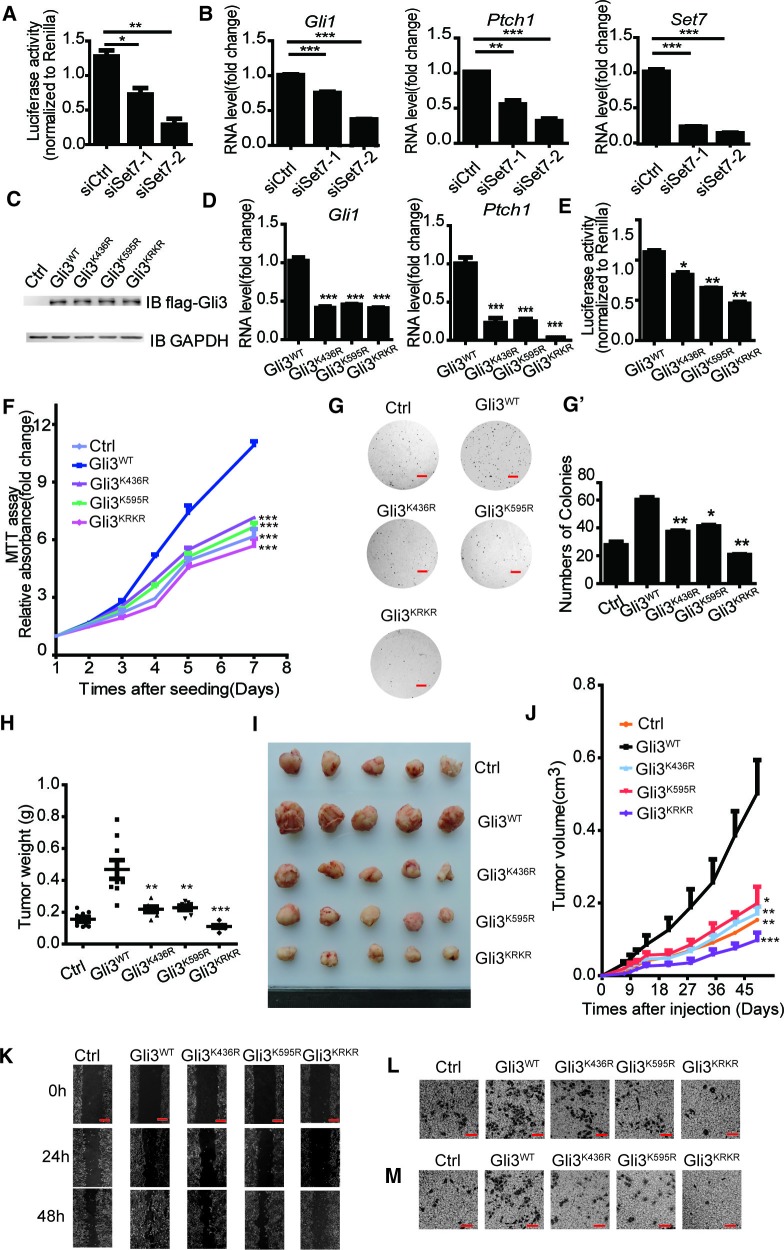
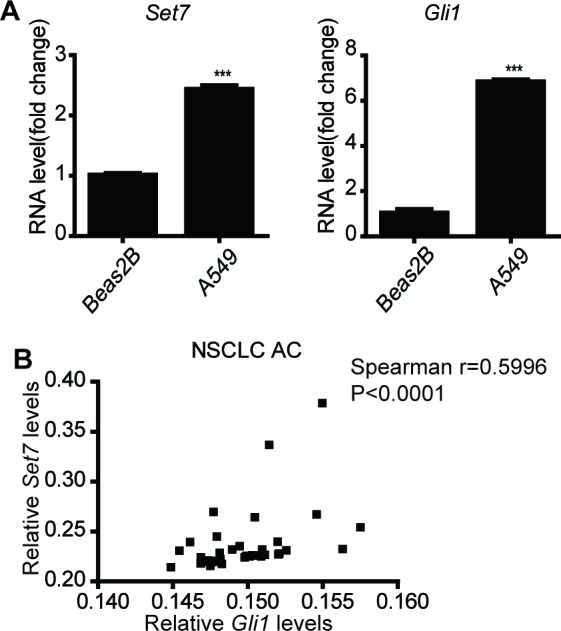
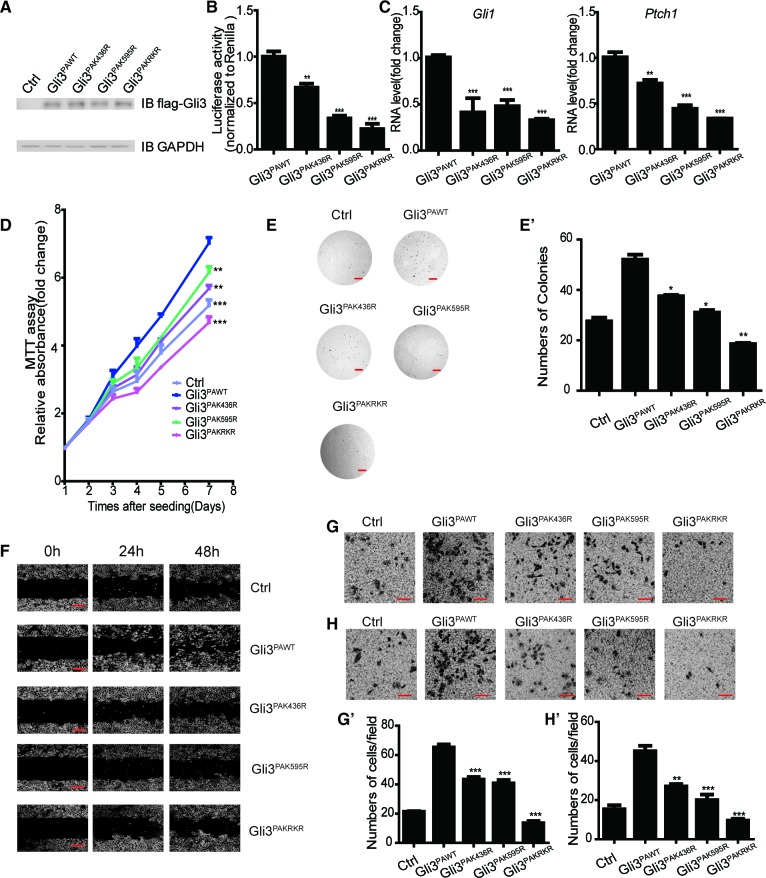
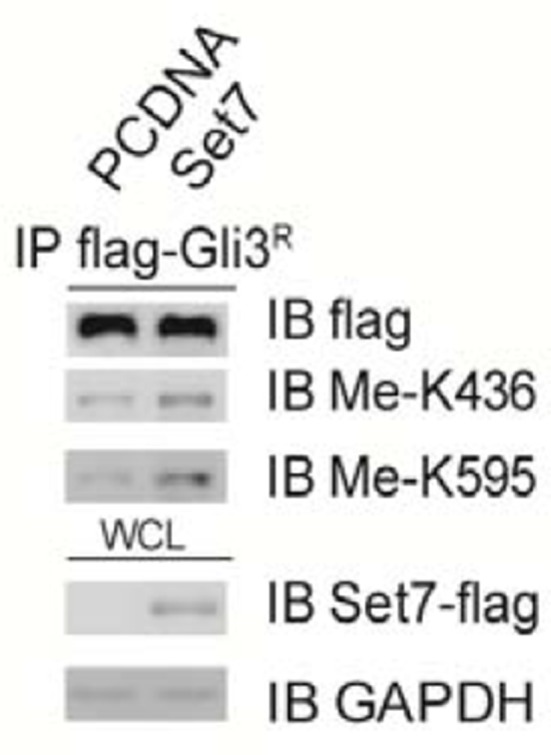
Hedgehog signaling plays very important roles in development and cancers. Vertebrates have three transcriptional factors, Gli1, Gli2 and Gli3. Among them, Gli3 is a very special transcriptional factor which closely resembles Cubitus interruptus (Ci, in Drosophila) structurally and functionally as a 'double agent' for Shh target gene expression. Here we show that Gli3 full-length, but not the truncated form, can be methylated at K436 and K595. This methylation is specifically catalyzed by Set7, a lysine methyltransferase (KMT). Methylation at K436 and K595 respectively increases the stability and DNA binding ability of Gli3, resulting in an enhancement of Shh signaling activation. Furthermore, functional experiments indicate that the Gli3 methylation contributes to the tumor growth and metastasis in non-small cell lung cancer in vitro and in vivo. Therefore, we propose that Set7 mediated methylation is a novel PTM of Gli3, which positively regulates the transactivity of Gli3 and the activation of Shh signaling.

Keywords: Gli3; Set7; biochemistry; cancer biology; hedgehog signaling; methylation; mouse; tumorigenesis.


Conflict of interest statement

The authors declare that no competing interests exist.

Figures

Figure 1.
Figure 1.. Set7 methylates Gli3 full-length in vivo and in vitro.
(A) Sequence alignment of the reported Set7 substrates with Gli3K436 and Gli3K595 (upper). Schematic representation of Gli3 protein and the truncated peptide used in in vitro methylation assay (B) and GST pull-down assay (C) (lower). (B) In vitro methylation assay with 3H-S-adenosine-methionine (3H-SAM), bacteria purified Set7 and MBP fusion protein. * and ** represent the MBP-K436 and MBP-K595 respectively. (C) GST pull-down assay using GST-Set7 and MBP tagged Gli3 truncated fragments described in (A). * and ** represent the MBP-K436 and MBP-K595 respectively. (D–F) Western blot of immunoprecipitates (top three panels) and lysates (bottom) from HEK293T cells expressing indicated siRNAs or proteins. * and ** represent the full-length and repressor forms of Gli3 respectively. (G–I) Western blot of immunoprecipitates (top three panels) and lysates (bottom) from NIH-3T3 cells stably expressing indicated shRNAs or proteins. (I’) Schematic representation of 6 PKA targeted serines which were mutated to nonphosphorylatable alanines in Gli3PA. (J) GST pull-down assay using GST-Set7 and flag-Gli3 in NIH-3T3 cells in the presence of Shh. Ctrl, Control. Me-K436, antibody anti methylated Gli3-K436; Me-K595, antibody anti methylated Gli3-K595. WCL, whole cell lysis. The protein level of Gli3 in (D–I) are normalized to the same. DOI: http://dx.doi.org/10.7554/eLife.15690.003
Figure 1—figure supplement 1.
Figure 1—figure supplement 1.. The mass spectrometry results show the methylation modification in the full-length Gli3 on K436 and K595.
(A) Sliver staining of the mass spectrometry sample. * represent the Gli3 full-length, ** represent the Gli3 repressor. (B and C) The mass spectrometry results of the methylation modification on K436 (B) and K595 (C) in the Gli3 full-length sample. DOI: http://dx.doi.org/10.7554/eLife.15690.004
Figure 1—figure supplement 2.
Figure 1—figure supplement 2.. Sequence alignment of K436 and K595 sites of Gli3 in different species Sequence alignment of the methylation sites K436.
(A) and K595 (B) in Gli3 from different species suggested that these two sites are evolution conserved. DOI: http://dx.doi.org/10.7554/eLife.15690.005
Figure 1—figure supplement 3.
Figure 1—figure supplement 3.. The methylation antibodies can specifically recognize the mono methylated Gli3 peptides.
(A) The sequences of peptides used for preparing antibodies. (B) Dot blots of peptides described in (A). Me-K436, antibody against methylated Gli3-K436; Me-K595, antibody against methylated Gli3-K595. DOI: http://dx.doi.org/10.7554/eLife.15690.006
Figure 1—figure supplement 4.
Figure 1—figure supplement 4.. The methylation antibodies can specifically recognize the mono methylated Gli3 full length in embroynic lung Indicated tissues from mouse embryos (14.5 dpc) were isolated and lysed.
Methylation signals on Gli3 full length were detected by western blots. DOI: http://dx.doi.org/10.7554/eLife.15690.007
Figure 2.
Figure 2.. Methylation by Set7 promotes the Sonic Hedgehog signaling activity.
(A–C) Shh luciferase reporter assays in NIH-3T3 cells expressing indicated siRNAs or proteins. (A’) Set7 level changes in NIH-3T3 cells expressing indicated Set7 siRNAs. n.s. p>0.05, ***p<0.005 versus siCtrl respectively in (A). (D and E) qPCR to detect Shh target gene, Gli1 and Ptch1, in Shh treated NIH-3T3 cells after Set7 knockdown. ***p<0.005 versus siCtrl. (F) Western blot to detect protein level changes of Set7 and Gli1 in (D and E). (G) Shh luciferase reporter assay in Shh treated NIH-3T3 cells transfected with indicated siRNAs. ***p<0.001, n.s. p>0.05 versus siCtrl siCtrl respectively. (H–J) mRNA level changes of Gli1 and Ptch1 (H and I) and Shh luciferase activity changes (J) in Shh treated NIH-3T3 cells transfected with unmethylatable mutants, Gli3K436R and Gli3K595R. *p<0.05, **p<0.01, ***p<0.001 versus Gli3WT (K and L) Shh luciferase assay in Shh treated NIH-3T3 cells expressing indicated siRNAs or/and proteins., **p<0.01, ***p<0.001 versus siCtrl Gli3WT or PCDNA Gli3WT respectively.. Results in (A–E, GL) are shown as mean ± SEM (n=3). All the qPCR results are normalized to GAPDH. Ctrl, Control. DOI: http://dx.doi.org/10.7554/eLife.15690.008
Figure 2—figure supplement 1.
Figure 2—figure supplement 1.. Sonic hedgehog signaling increases the mRNA level of Set7.
(A and B) qPCR of Set7 in NIH-3T3 cells treated with Shh (A) and SAG (B). **p<0.01 ***p<0.001 versus Ctrl. (C and D) qPCR of Gli1 (C) and Set7 (D) in NIH-3T3 cells transfected with Gli1 siRNA. **p<0.01 ***p<0.001 versus siCtrl. Results are shown as mean ± SEM (n=3). All the qPCR results are normalized to GAPDH. DOI: http://dx.doi.org/10.7554/eLife.15690.009
Figure 2—figure supplement 2.
Figure 2—figure supplement 2.. The methtylation of Gli3 is regulated by the Shh signaling Western blot of endogenous Gli3 immunoprecipitates from NIH-3T3 cells with or without Shh treatment. * and ** represent the full-length and repressor forms of Gli3 respectively.
The protein density of Gli3 full length and methylation signals is analyzed using ImageJ. DOI: http://dx.doi.org/10.7554/eLife.15690.010
Figure 2—figure supplement 3.
Figure 2—figure supplement 3.. In the Gli1-/-; Gli2-/- MEF cells, Set7 still regulates the Shh signaling.
(A) qPCR to detect Ptch1 in Shh treated Gli1-/-;Gli2-/- MEF cells with Set7 knockdown. *p<0.05 versus Ctrl. (B) qPCR to detect Set7 in Shh treated Gli1-/-;Gli2-/- MEF cells with Set7 knockdown. ***p<0.001 versus Ctrl. Results are shown as mean ± SEM (n=3). All the qPCR results are normalized to GAPDH. DOI: http://dx.doi.org/10.7554/eLife.15690.011
Figure 2—figure supplement 4.
Figure 2—figure supplement 4.. Non-methylation mutants show reduced Gli1 and Ptch1 mRNA level, and decreased Shh luciferase activity.
(A and B) qPCR of Gli1 and Ptch1 (A) and Shh luciferase activity (B) in NIH-3T3 cells expressing indicated proteins. *p<0.05, **p<0.01, ***p<0.001. Results are shown as mean ± SEM (n=3). All the qPCR results are normalized to GAPDH. DOI: http://dx.doi.org/10.7554/eLife.15690.012
Figure 3.
Figure 3.. Set7 improved the stability and DNA binding ability respectably through K436 and K595 methylation.
(A and B) Western blot (A) and qPCR (B) of Gli3 in the condition of Set7 knockdown or overexpression in NIH-3T3 cells. n.s. p>0.05 versus siCtrl (left) or PCDNA (right) respectively. (C and D) Western blot of Gli3WT, Gli3K436R or Glli3K595R in the condition of Set7 knockdown or overexpression in NIH-3T3 cells. (E and F) Western blot (E) and statistic (F) of Gli3WT, Gli3K436R or Gli3K595R in NIH-3T3 cells treated with cycloheximide (CHX) for the indicated times. (G) Schematic representation of three Gli3 binding sites on the promoter regions of Gli1. (H) qPCR of Set7 in Gli3WT-flag stable cell lines after Set7 knockdown in (I). **p<0.01, ***p<0.00 versus siCtrl. (I) ChIP-qPCR analysis using Ctrl IgG (grey) or anti-flag antibody (black) in NIH-3T3 cells transfected with Ctrl or Set7 siRNAs. ChIP signal levels are represented as fold change of input chromatin. (J) Western blot of flag tagged Gli3WT and mutants in the stable cell lines used in (K). (K) ChIP-qPCR analysis using anti-flag antibody in NIH-3T3 cells expressing Gli3WT-flag, Gli3K436R-flag or Gli3K595R-flag. ChIP signal levels are represented as fold change of input chromatin. *p<0.05, **p<0.01, ***p<0.001, n.s. p>0.05 versus anti flag siCtrl (I) or Gli3WT-flag (K). Data are represented as mean ± SEM (n=3). All the qPCR results are normalized to GAPDH. In all the experiments, cells are treated with Shh. Ctrl, Control. DOI: http://dx.doi.org/10.7554/eLife.15690.013
Figure 3—figure supplement 1.
Figure 3—figure supplement 1.. Set7 does not influence the cilium translocation of Gli3.
(A and B) Immunofluorescent staining of Ac-tubulin (blue) and Gli3 (red) in the absence (A-A’’) or presence (B-B’’) of Shh. (C and D) Statistic results of Gli3 accumulation at cilia tips in NIH-3T3 cells with Set7 knockdown (C) or Set7/Set7H297A over-expression (D). In all experiments of (C and D), cells were treated with Shh. Data are represented as mean ± SEM (n=3). Ctrl, Control. DOI: http://dx.doi.org/10.7554/eLife.15690.014
Figure 3—figure supplement 2.
Figure 3—figure supplement 2.. Set7 improves the DNA binding ability of Gli3 on Gli1 promoter.
(A) ChIP-qPCR analysis at Gli1 loci (Figure 3G) using control IgG or anti-Gli3 antibody in NIH-3T3 cells transfected with control or Set7 siRNAs. ChIP signal levels are represented as fold change of input chromatin. **p<0.01, ***p<0.001, versus anti Gli3 siCtrl. (B) qPCR of Set7 in NIH-3T3 cells with Set7 knockdown. RNAi efficiency was shown. Data are represented as mean ± SEM (n=3). **p<0.01 versus siCtrl. Ctrl, Control. All the qPCR results are normalized to GAPDH. DOI: http://dx.doi.org/10.7554/eLife.15690.015
Figure 3—figure supplement 3.
Figure 3—figure supplement 3.. Set7 improves the DNA binding ability of Gli3 on the promoter regions of Hhip and Ptch1 ChIP-qPCR assays at Hhip.
(A) and Ptch1 (B) loci using control IgG or anti-flag antibody in NIH-3T3 Gli3-flag stable cells transfected with control or Set7 siRNA. ChIP signal levels are represented as fold change of input chromatin. *p<0.05, **p<0.01, ***p<0.001, versus anti flag siCtrl. DOI: http://dx.doi.org/10.7554/eLife.15690.016
Figure 4.
Figure 4.. Methylation of Gli3 positively regulated the A549 proliferation and migration ability.
(A and B) Shh luciferase reporter assay (A) and qPCR (B) of Gli1, Ptch1 and Set7 in A549 cells in the condition of Set7 knockdown. (C) Western of flagged Gli3WT, Gli3K436R, Gli3K595R or Gli3KRKR in A549 stable cells used in (D-M). (D and E) qPCR (D) of Gli1 and Ptch1 and Shh luciferase reporter assay (E) in A549 cells expressing Gli3WT, Gli3K436R, Gli3K595R or Gli3KRKR. (F) MTT assays in A549 cells expressing indicated proteins. (G and G’) Photography (G) and statistic results (G’) of anchorage-independent growth assay in A549 cells expressing indicated proteins. (H and I) Statistic (H) and photography (I) results of tumor size in A549 cells expressing indicated proteins. (J) Tumor growth curves of A549 cells express indicated protein in a xenograft mouse model. (K–M) Migration ability evaluated by wound healing assay (K) and transwell migration assay (L). Invasiveness evaluated by matrigel invasion assay (M) in A549 cells expressing indicated proteins. All the qPCR results are normalized to GAPDH. Data in (D–H, J) were represented as mean ± SEM (n=3). *p<0.05, **p<0.01, ***p<0.001 versus Gli3WT. Ctrl, Control. DOI: http://dx.doi.org/10.7554/eLife.15690.017
Figure 4—figure supplement 1.
Figure 4—figure supplement 1.. The involvement of this Set7-Gli3-Gli1 axis in the development of NSCLCs
(A) Comparison of mRNA levels of Gli1 and Ptch1 in Beas2B and A549 cells by qPCR. The qPCR results are normalized to GAPDH. Data wad represented as mean ± SEM (n=3). (B) Correlation of Set7 and Gli1 mRNA levels in NSCLC samples. DOI: http://dx.doi.org/10.7554/eLife.15690.018
Figure 4—figure supplement 2.
Figure 4—figure supplement 2.. Methylation on the Gli3PA promoted the A549 tumorigenesis.
(A) Western blot of flagged Gli3PAWT, Gli3PAK436R, Gli3PAK595R or Gli3PAKRKR in A549 stable cells used in (B-H). (B and C) Hh luciferase reporter assay (B) and qPCR (C) of Gli1 and Ptch1 in A549 cells expressing flagged Gli3PAWT, Gli3PAK436R, Gli3PAK595R or Gli3PAKRKR. (D) MTT assays in A549 cells expressing indicated proteins. (E and E’) Photography (E) and statistic results (E’) of anchorage-independent growth assay in A549 cells expressing indicated proteins. (F-H) Migration ability evaluated by wound healing assay (F) and transwell migration assay (G). Invasiveness evaluated by matrigel invasion assay (H) in A549 cells expressing indicated proteins. (G’ and H’) Statistic results of migration (G’) and invasion (H’) ability of A549 cells expressing indicated proteins. Data in (B-D, G’, H’) were represented as mean ± SEM (n=3). Ctrl, Control. All the qPCR results are normalized to GAPDH. DOI: http://dx.doi.org/10.7554/eLife.15690.019
Author response image 1.
Author response image 1.. Methylation signals in Gli3R when both Set7 and Gli3R were overexpressed.
DOI: http://dx.doi.org/10.7554/eLife.15690.020

Similar articles

Cited by

References

    1. Biggar KK, Li SS. Non-histone protein methylation as a regulator of cellular signalling and function. Nature Reviews. Molecular Cell Biology. 2015;16:5–17. doi: 10.1038/nrm3915. - DOI - PubMed
    1. Bikkavilli RK, Malbon CC. Wnt3a-stimulated LRP6 phosphorylation is dependent upon arginine methylation of G3BP2. Journal of Cell Science. 2012;125:2446–2456. doi: 10.1242/jcs.100933. - DOI - PMC - PubMed
    1. Chen MH, Wilson CW, Chuang PT. Snapshot: Hedgehog signaling pathway. Cell. 2007;130:386. doi: 10.1016/j.cell.2007.07.017. - DOI - PubMed
    1. Chen MH, Wilson CW, Li YJ, Law KK, Lu CS, Gacayan R, Zhang X, Hui CC, Chuang PT, Li YJ Law KK. Cilium-independent regulation of Gli protein function by sufu in hedgehog signaling is evolutionarily conserved. Genes & Development. 2009;23:1910–1928. doi: 10.1101/gad.1794109. - DOI - PMC - PubMed
    1. Chuikov S, Kurash JK, Wilson JR, Xiao B, Justin N, Ivanov GS, McKinney K, Tempst P, Prives C, Gamblin SJ, Barlev NA, Reinberg D. Regulation of p53 activity through lysine methylation. Nature. 2004;432:353–360. doi: 10.1038/nature03117. - DOI - PubMed

Publication types

MeSH terms